What is customer journey analytics? How to visualize, measure, and improve touchpoints
Published on June 26, 2025/Last edited on June 26, 2025/14 min read

Team Braze
Every click, scroll, opt-in, or drop-off can tell a story. By measuring their customer journey analytics, brands can uncover how individuals move through digital touchpoints, allowing them to better understand what’s happened, why it happened, and make informed decisions about what to do next.
This article breaks down what customer journey analytics are, how it differs from other tools, and how it helps brands reduce churn, improve lifetime value, and deliver more personalized, timely messages.
Contents
- What is customer journey analytics?
- How customer journey analytics differs from other tools
- Why customer journey analytics matters
- Data sources and KPIs that power customer journey analysis
- Choosing the right customer journey analytics tools
- How Braze operationalizes customer journey analytics in real time
- Comparing top customer journey analytics software
- Final thoughts on customer journey analytics
- Customer journey analytics FAQs
What is customer journey analytics?
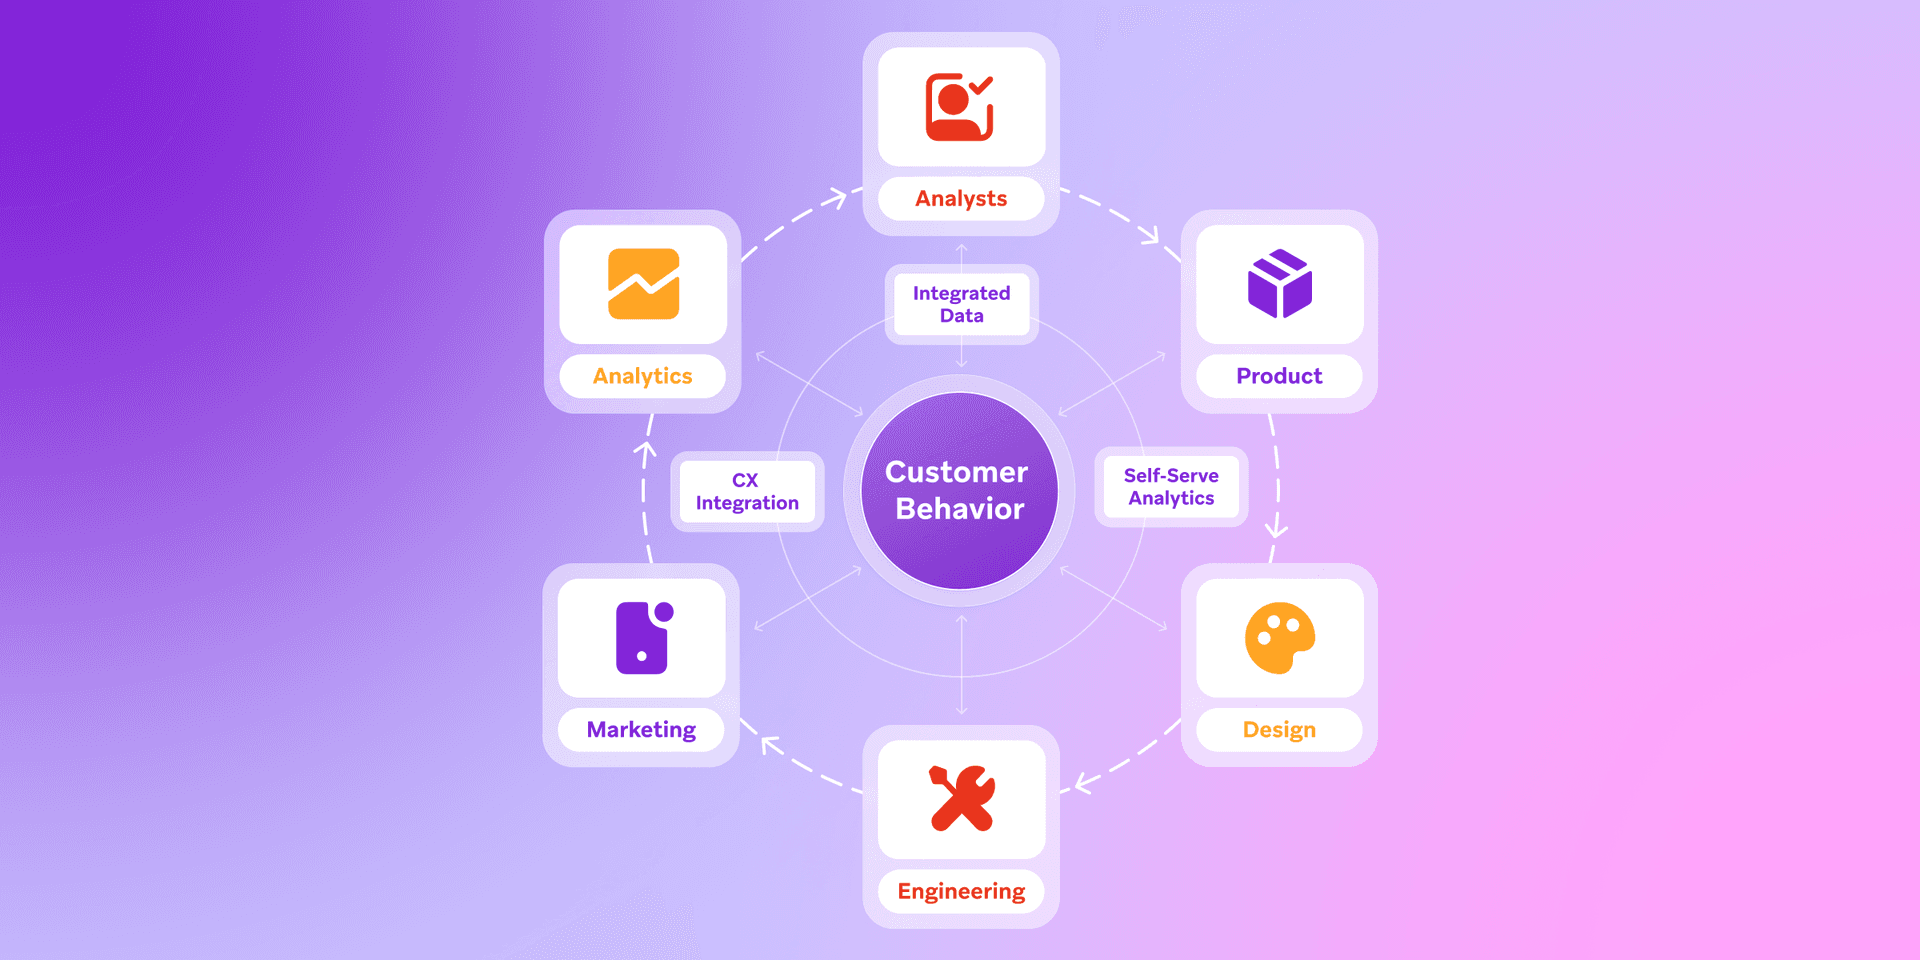
Customer journey analytics is the practice of tracking and analyzing how individuals interact with a brand across multiple channels and touchpoints over time. Unlike single-channel or one-off metrics, this approach pulls together data from every stage of the customer lifecycle—connecting the dots between what people do, when they do it, and why.
The right analytics are not about vanity metrics. They help brands build a live, connected view of their users’ real behavior, showing how people move from one message to the next, where friction appears in the customer journey, and what drives action over time.
When teams can see the full picture, they can do more than analyze what happened—they can respond in real time, taking full advantage of where a customer might be at that very moment, and meeting their needs without any lag. Analyzing the customer journey helps marketers move with their audience, using real data to personalize timing and content, improve message flow, and guide people toward outcomes that drive real value.
How customer journey analytics differs from other tools
Lots of platforms offer data capture and measurement, but they don't all help you understand how your customers are progressing through their experience with your brand. And they don't often give you the tools to respond or change that experience for the good of your audience. Customer journey analytics make that possible, and here's how this approach compares to others.
Web analytics
Web analytics tools focus on on-site behavior—things like pageviews, bounce rates, and session durations. They're helpful for understanding how users move through a website, but they fall short when it comes to cross-channel visibility. These tools typically can't connect a user's behavior across devices or link it to mobile engagement, email interactions, or in-app activity.
Customer journey analytics track individuals—not just sessions—across digital touchpoints, revealing the context behind their behavior and giving marketers a clearer picture of what’s working and where people drop off.
Product analytics
Product analytics zero in on how users interact with features inside an app or platform. They're a powerful tool for product teams looking to improve UX or reduce churn, but are often disconnected from broader engagement strategies.
Customer journey analytics fills that gap. They merge in-app behavior with messaging and channel-level performance, helping marketers understand not just what people do, but how they respond to outreach along the way. That means teams can prioritize based on real-time signals, not gut feelings.
Customer journey mapping
Customer journey mapping tools help visualize an ideal experience—but they rarely reflect what’s really happening. Built for planning rather than analysis, these tools tend to be static, qualitative, and disconnected from live behavioral data.
Customer journey analytics brings those journeys to life. With real-time data and actionable insights, marketers can adapt messaging paths in real time, test different approaches, and orchestrate cross-channel experiences that reflect what people actually need in the moment.
Why customer journey analytics matters
When you can see the full path your customers take across channels, campaigns, and moments, you can make better decisions and get stronger results. Customer journey analytics takes fragmented data and molds it into insight you can act on, helping teams shift from reactive reporting to proactive optimization.
Here’s what that looks like in practice:
Lower churn
By spotting drop-off points in real time, teams can adjust messaging flows, trigger re-engagement tactics, or test alternative journeys before users slip away.
Higher lifetime value
With a clearer picture of which paths lead to high-value behaviors, marketers can nudge more users in that direction—personalizing content, tone of voice, and timing based on what actually works.
Smarter segmentation and personalization
Journey analytics makes it easier to group audiences based on behavior, not just static attributes. That means more relevant messaging and better outcomes across every stage of the lifecycle.
Campaign optimization
Instead of waiting for end-of-month reports, teams can monitor live performance and pivot in the moment. If a push sequence underperforms or a conversion path breaks down, journey analytics makes it possible to catch it, test fixes, and iterate fast.
Data sources and KPIs that power customer journey analysis
It’s important to keep in mind that the “right” metrics to track will vary depending on your unique brand, your business goals, your audience, and the specific engagement channels you’re using. That said, here is a broad overview of the types of key performance indicators (KPIs) you should consider monitoring using a marketing performance reporting tool to support a holistic understanding of your brand’s performance.
Conversion metrics
These KPIs will help you track the high-value actions your customers are taking in connection with your app, website, or other digital touchpoints.
- Conversions: Total number of desired actions completed (purchases, app downloads, email opt-ins, etc.) resulting from your marketing campaigns
- Conversion event (name, rate): Specific types of conversions you're tracking, such as:
- Purchase rate: Percentage of users who make a purchase
- Download rate: Percentage of users who install your app
- Signup rate: Percentage of users who create an account
- Conversion rate: Percentage of users who complete your desired action (e.g. "11% of email recipients joined your loyalty program").
Monetization metrics
Keeping an eye on these metrics will help your monetization campaigns reach their desired effect and make it more likely that you drive the behaviors that support business growth.
- Purchases (over time, weekly, monthly, etc.): The number of items customers buy in a given period or product category
- Revenue (over time; by segment, campaign, region, etc.): This is a measure of the number of items sold times the price of the items sold; you’ll likely want to track different revenue calculations, including lifetime revenue, lifetime value per user, average daily revenue, and daily revenue per user.
- Average number of basket or cart items: The average number of items customers purchase at one time
- Average order value (AOV) or average basket value: The average value per customer transaction, as calculated by taking the total revenue divided by the total number of orders
- Order frequency or purchase frequency: This is the number of orders or purchases in a given period, divided by the number of customers who purchased during that time period
- Upsell rate/purchase add-on rate: The percent of customers who are successfully upsold or add an extra item to their order; calculated by the number of customers who purchase an upsell or an add-on, divided by the total number of customers who complete a purchase during a given time period
Customer health, retention, and loyalty metrics
When these metrics improve, you’ll be better positioned to fuel long-term, sustainable outcomes.
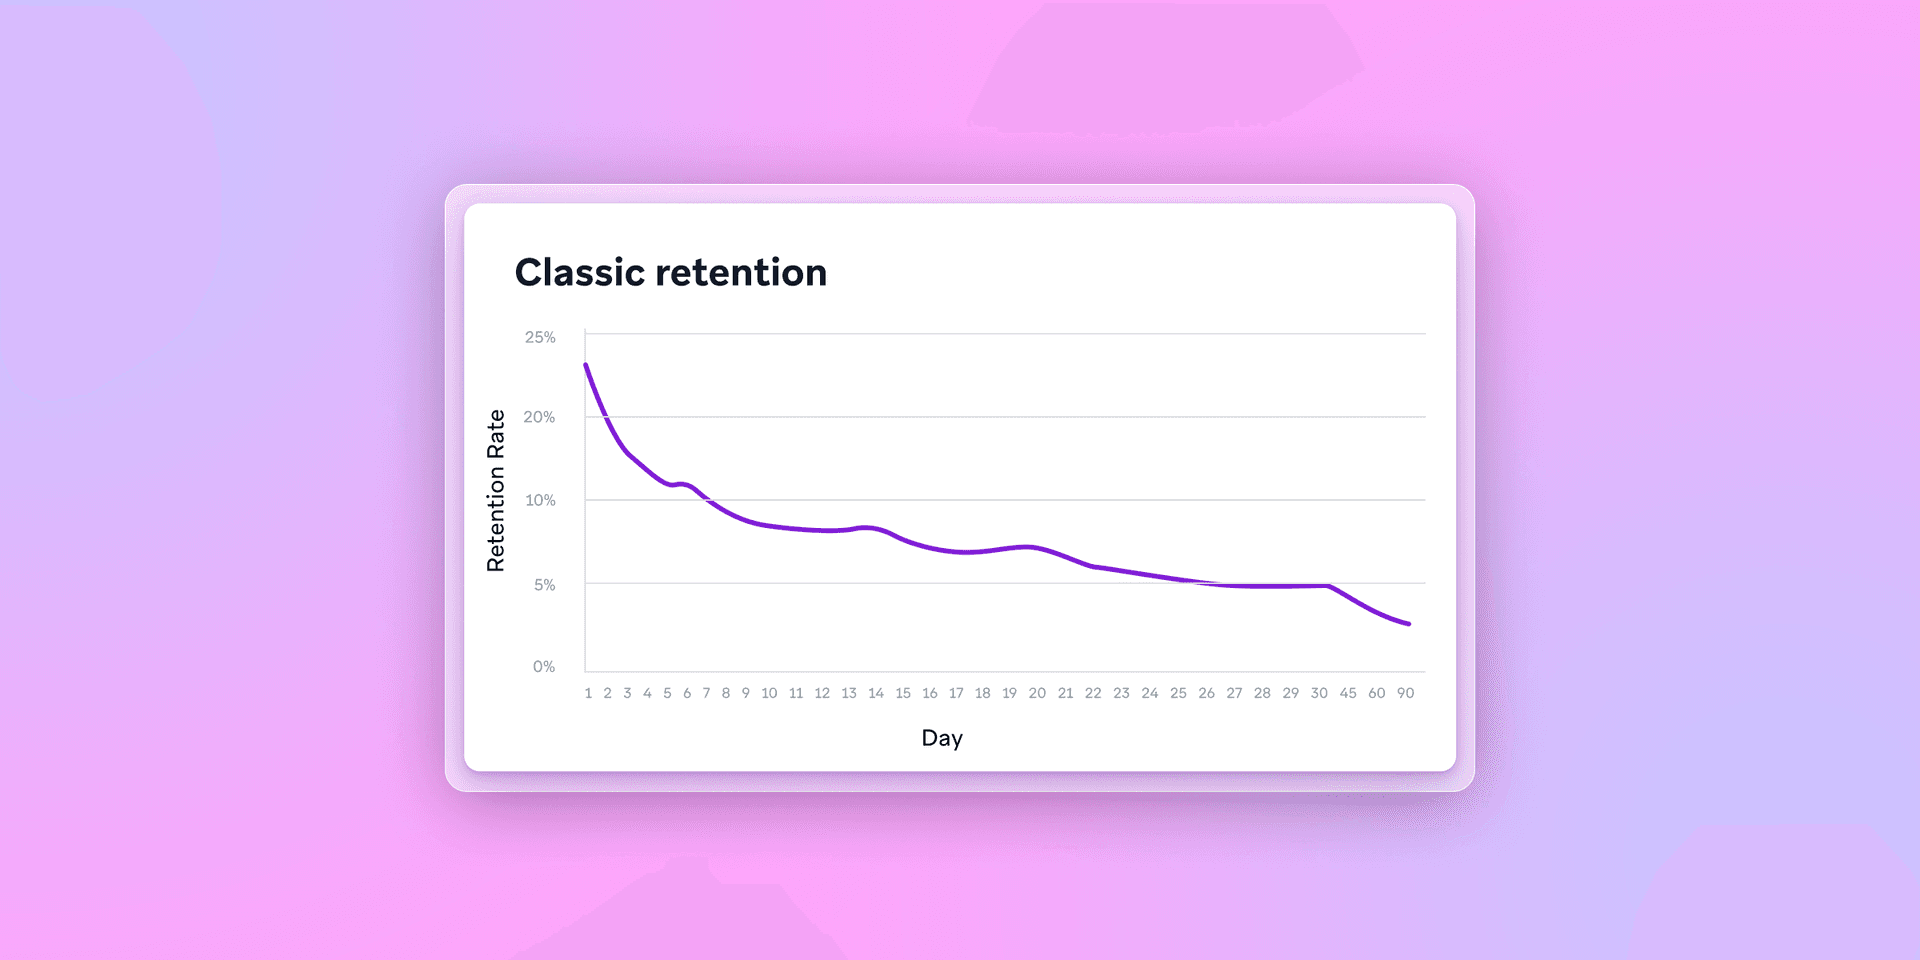
- Retention rate: Percentage of customers retained (who haven’t churned) over a given time period (Note: There are various ways of calculating retention rate, so choose an approach that fits your specific business and needs)
- Customer lifetime value (by channel, etc.): The total revenue a brand can expect a customer to generate over their entire relationship with the brand
- Ratio between customer acquisition costs (CAC) and customer lifetime value (CLV), over time by segment, and by cohort: This allows marketers to understand the ROI on their customer acquisition efforts more effectively
- CAC payback period (over time by segment, and by cohort): A measure of how long it takes for CLV to catch up to, and cover the costs of acquiring any individual user, segment, or cohort; this customer engagement metric sheds light on the profitability of segments, not just a company's overall profitability, and helps measure whether customer profitability increases with time.
Key messaging campaign metrics
At the channel level, here’s a range of KPIs that will help you manage and optimize your messaging touchpoints across mobile, web, and more.
- Audience growth: Rate of growth of users by channel (mobile, email, web, etc.) by month, quarter, and year
- Sends: Number of messages sent (such as number of emails sent for a given campaign)
- Delivery rate: The percentage of emails or SMS campaigns that are successfully delivered, and do not bounce; a good email delivery rate is around 98%
- Opens: Number of messages opened (such as email opens, push opens, etc.); for email, the rise of Apple’s Mail Privacy Protection has complicated the value of opens, but they still provide insight into your email audience.
- Clicks and click rate: The total number and percentage of users who have clicked within a given message, inclusive of a user clicking on something multiple times; this can be used across different messaging channels, including email, SMS, and Content Cards
- Unique clicks: The specific number of recipients who have clicked somewhere within a message
- Impressions: The number of times a given campaign has been seen; this can be used for a variety of channels, including ads, Content Cards, in-app messages, and in-browser messages
- Unsubscribes or unsubscribe rate: The number of recipients who opt out of receiving future campaigns for a given campaign; this can be used for multiple channels, including push notifications, emails, and SMS
Email marketing campaign metrics
- Email bounces/email bounce rate: The number of emails that could not be delivered; the percentage of emails that could not be delivered out of the total number of emails sent.
- Spam rate or email complaint rate: The percent of emails that have been flagged as spam; this is important to track as it is an indicator of individual engagement, but it can also damage your email sender reputation, and overall email deliverability
- Non-open rate: The number of emails NOT opened, divided by the number of emails delivered; this rate tells us about the relative reach of each campaign
- Click-to-open rate: This is the number of unique user email clicks divided by the number of unique user opens, and the higher this is tells us whether we’ve given users a reason to not only open the campaign but click on the call to action
Keep reading to learn about even more essential email reporting KPIs and email marketing metrics.
Mobile marketing campaign metrics
- Active users (daily, monthly): Any user who has at least one app session during a given time period; active user campaigns are a great way to increase this number
- Push opt-in rate: The percent of your mobile app users who have opted into receiving push notifications out of your total mobile app users
- Direct push opens: The number of times your company’s app users open the push notifications they receive
- Influenced opens: The number of times your company’s app users manually open your app after receiving a push notification (vs. tapping on the notification to open the app) within a specified window after receipt
- Total push opens: The sum of your direct opens plus your influenced opens
Keep reading to learn about additional mobile messaging metrics. Plus, discover even more report metrics by channel for SMS, web push, Content Cards, and more.
Additional reporting
- Campaign performance over time: See how well your campaigns have performed across different factors
- Campaign and Canvas performance by channel: See how campaigns and canvases are performing by channel
- Funnel drop-off reports: Track where users are dropping off in your funnel
- Impact reports: See how your overall customer engagement efforts have driven incremental conversions
- Retention reports: Understand how your customer engagement campaigns and journeys are keeping your audience engaged and retained over time
- Variant analysis: Reports that reveal the winning variants in a campaign analysis (e.g. the top-performing channel combinations, timing, message copy, creative, etc.)
Download our guide to uncover what numbers matter most, how to act upon them, and the ways you can glean more data to drive stronger business results.
Choosing the right customer journey analytics tools
The challenge isn’t finding data, it’s finding tools that connect it, interpret it, and help you act on it without delay., And just as importantly, those customer journey analytics tools should fit how your team works, and slide neatly into your existing tech stack, not the other way around.
Here’s what to look for:
Cross-channel capabilities
Your tool should track behavior across email, mobile, web, SMS, in-app, and more—so you can see the full picture, not just isolated touchpoints.
Based on streaming data
Delayed insights mean missed opportunities. Look for platforms that offer live reporting and let you act on behavioral signals as they happen.
Unified data model
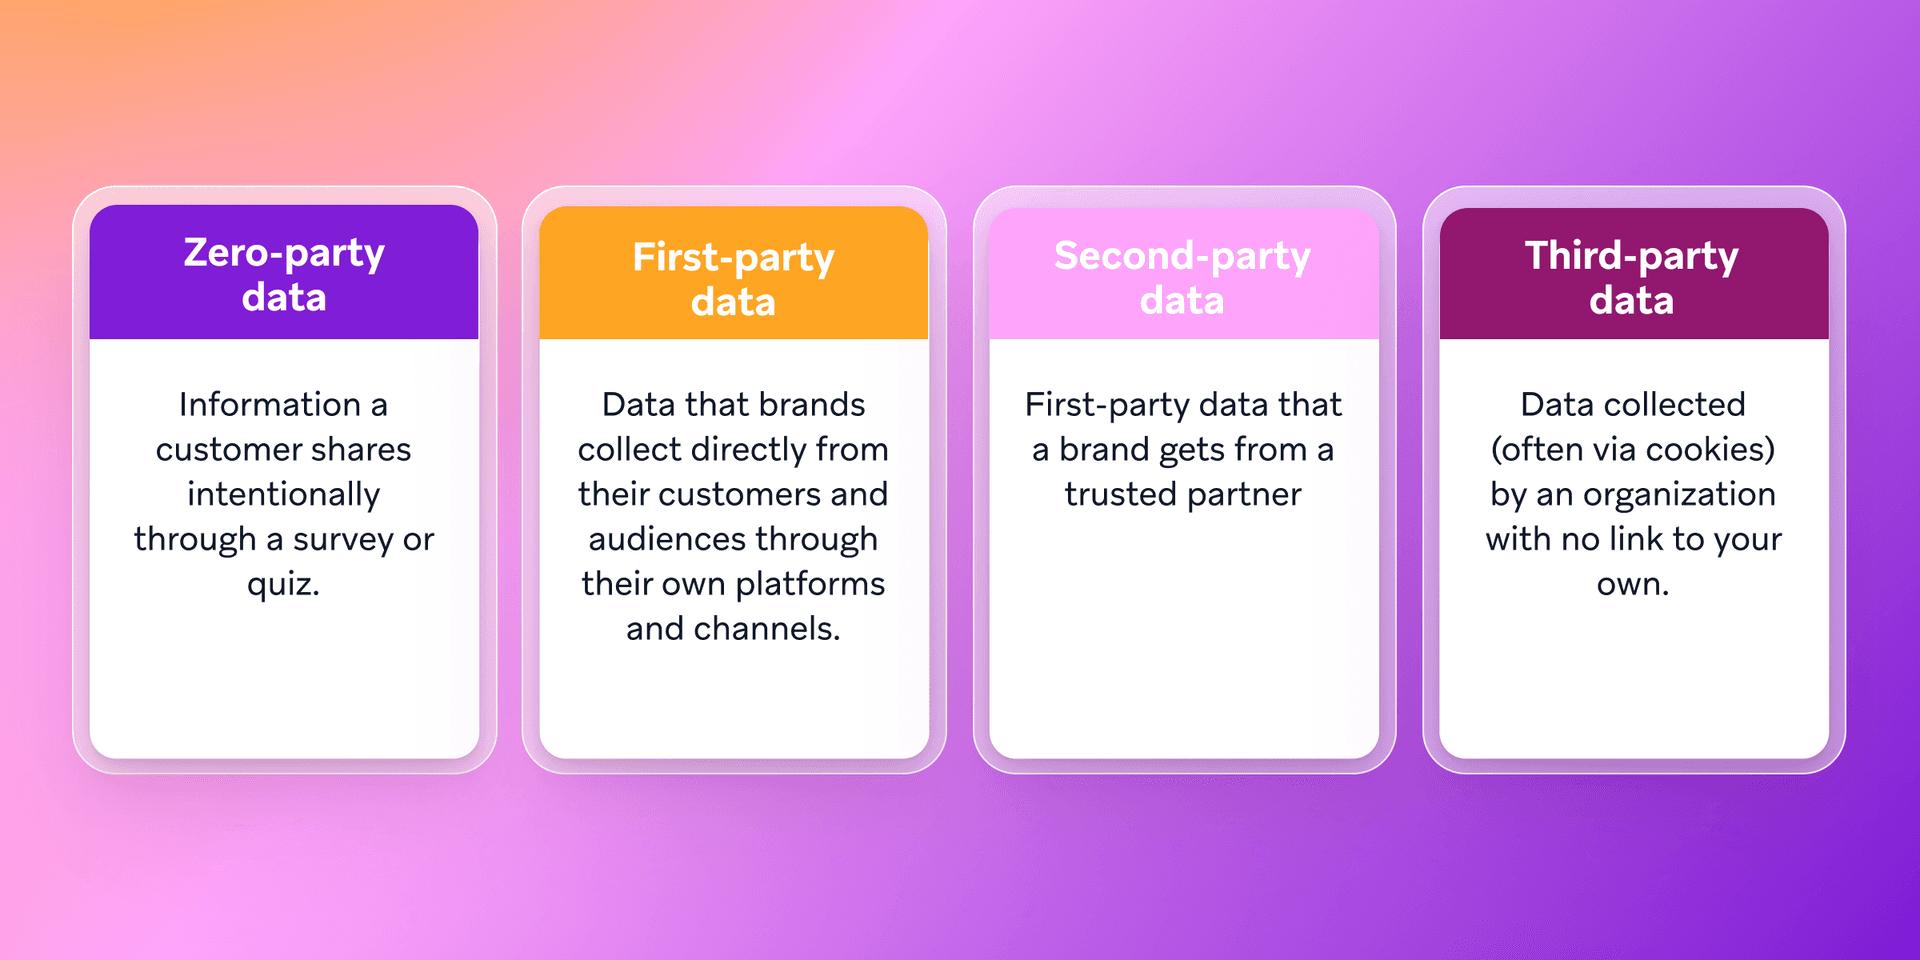
When customer data lives in silos, your insights do too. The best tools pull together zero, first, second, and third-party data to connect engagement, product usage, campaign performance, and user attributes in a single view.
Built-in orchestration
Analytics without action is just a report. Choose a platform that lets you build, test, and optimize customer journeys directly within the same system you use to analyze them.
Flexibility for your stack
Look for tools that offer robust integrations with your customer data platform (CDP), business intelligence (BI) tools, and downstream platforms—so your customer data flows freely, and your reporting stays relevant.
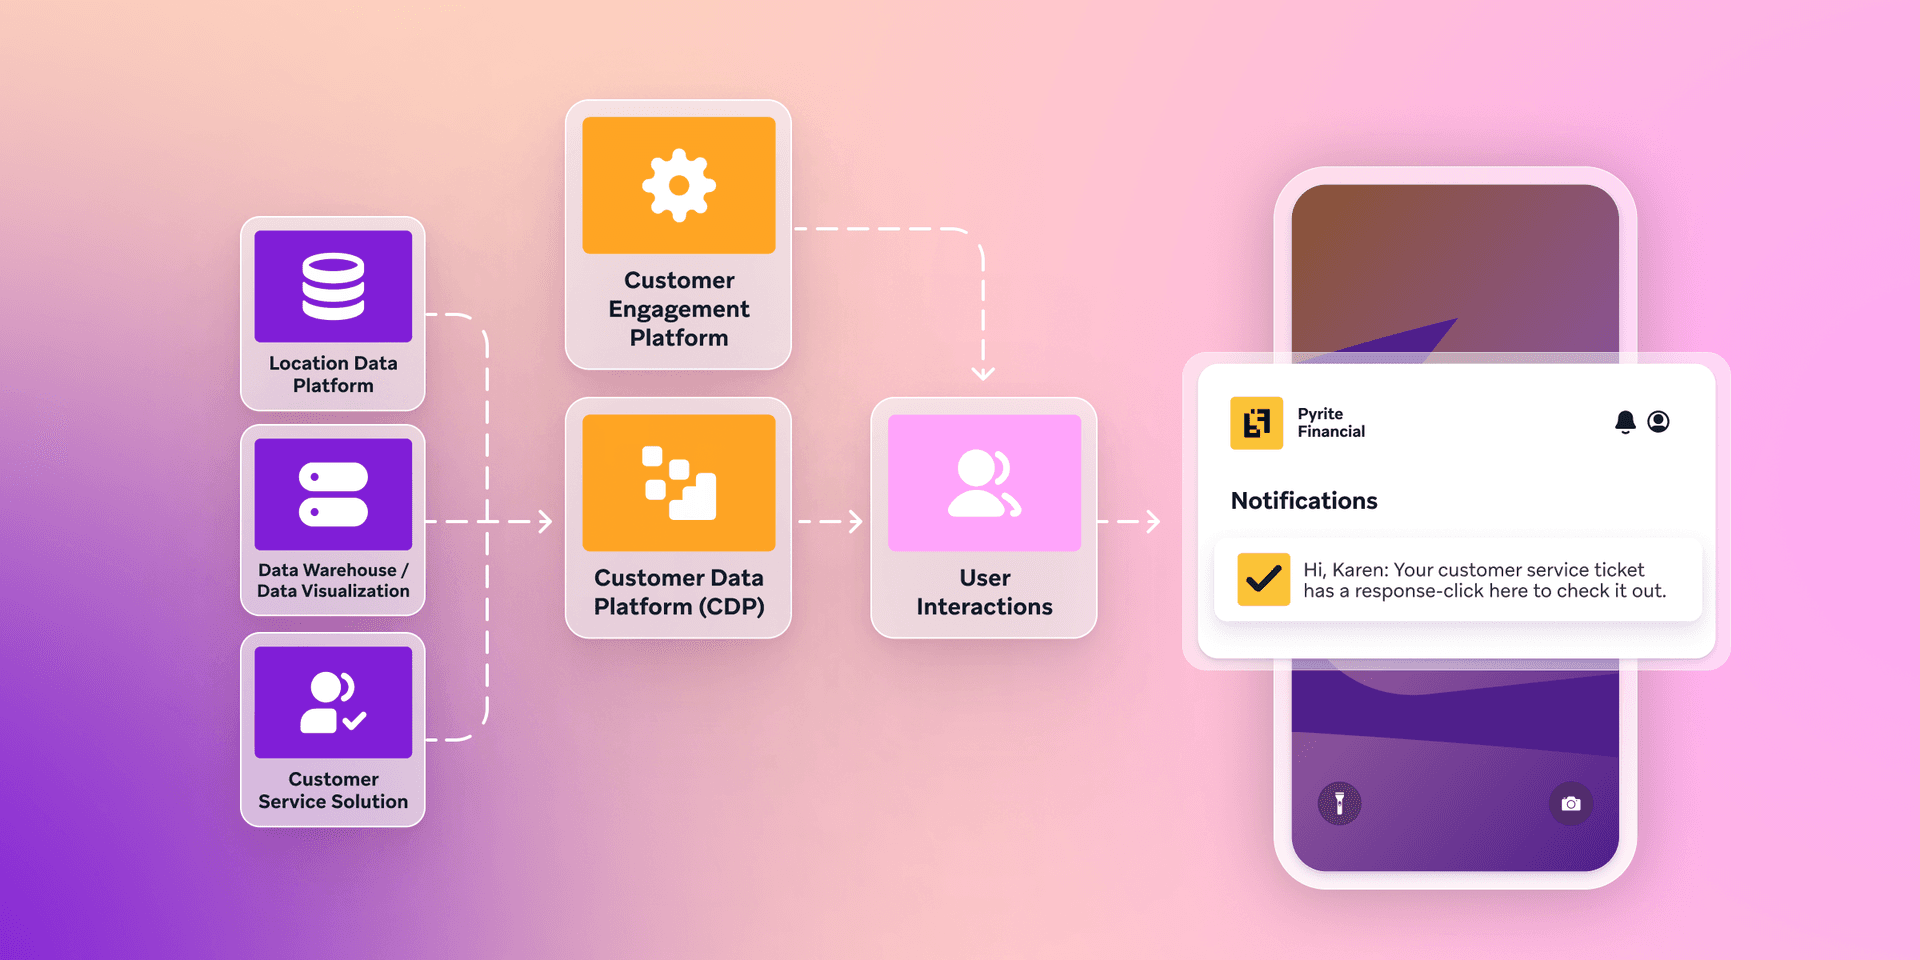
Some teams piece this together with multiple point solutions. But that often means slower insights, disconnected campaigns, and more work to keep everything in sync. A flexible platform will let you unify your data from different sources and other platforms, so that you don’t have to build from scratch.
How Braze operationalizes customer journey analytics in real time
If your analytics tool lives in a separate tab from your messaging platform, you’re already behind. Braze brings both together—so you can see what’s happening and act on it without switching systems or losing momentum.
Instead of passively tracking journeys, Braze helps you shape them. Here’s what that looks like in action:
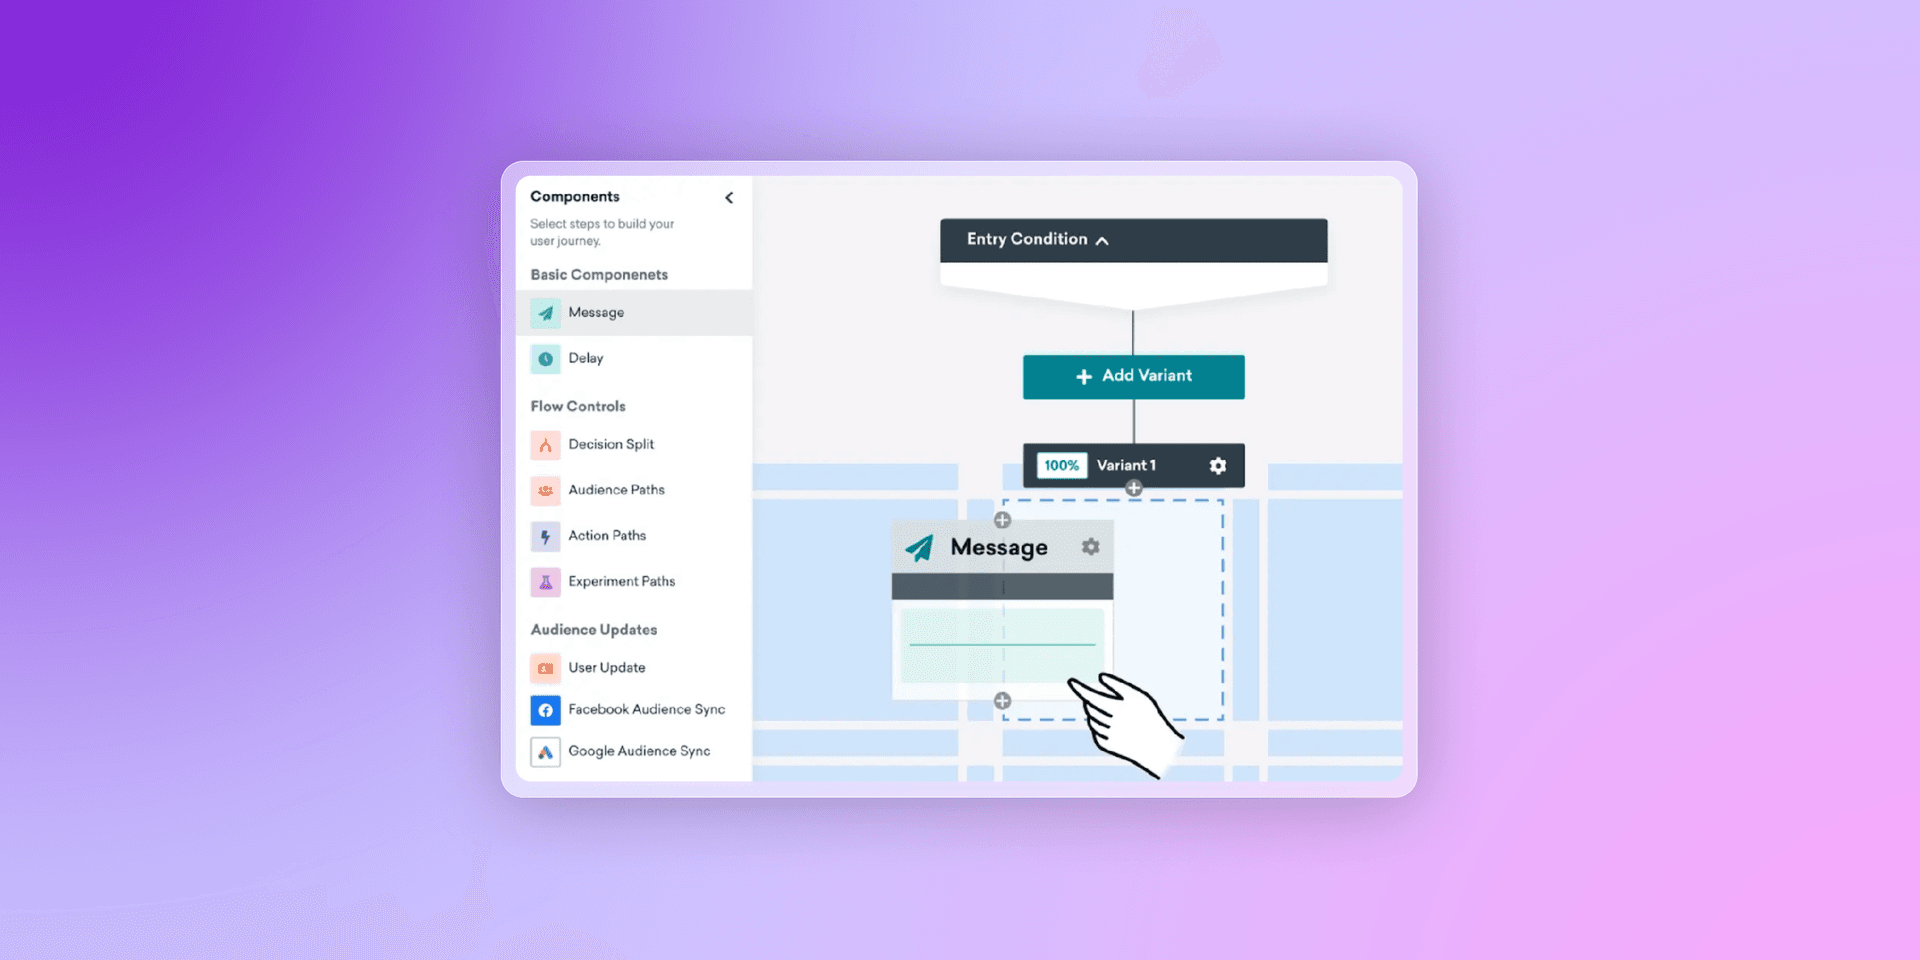
Canvas
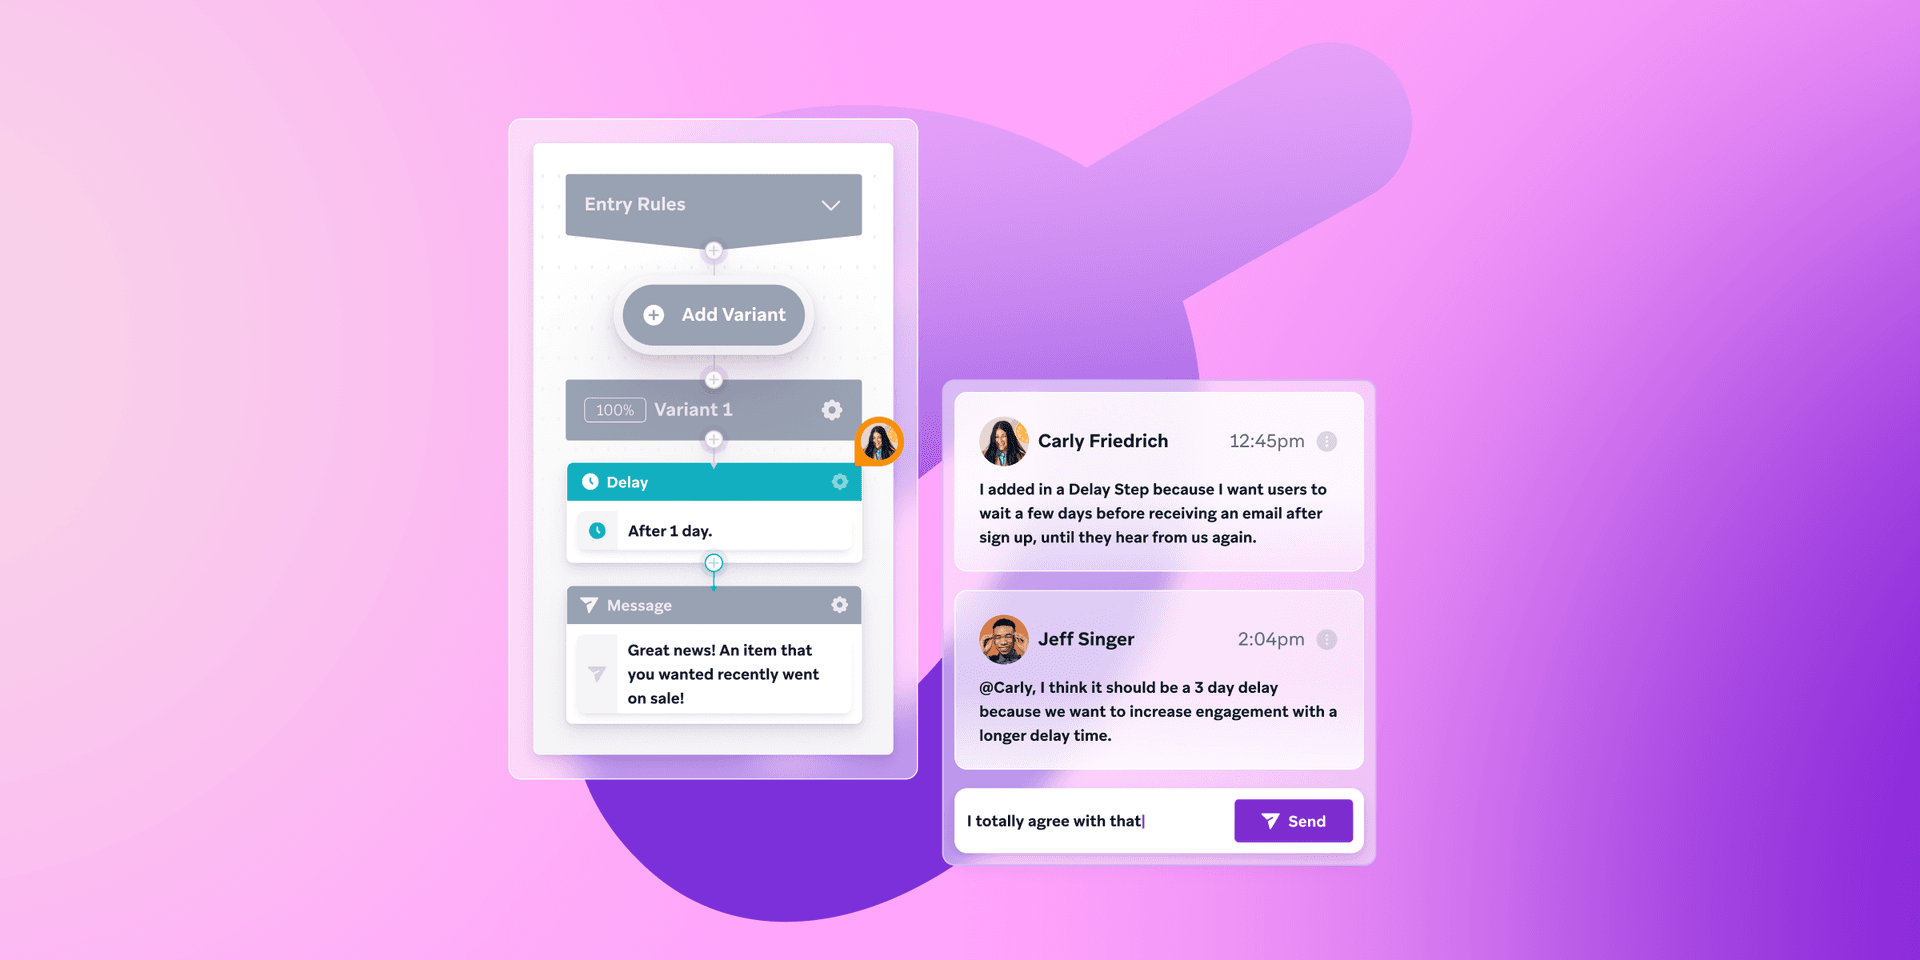
Design, test, and automate cross-channel journeys in a single view. With drag-and-drop logic, AI-powered personalization, and real-time triggers, Canvas lets teams adapt flows based on behavior, timing, and preferences—without needing engineering support.
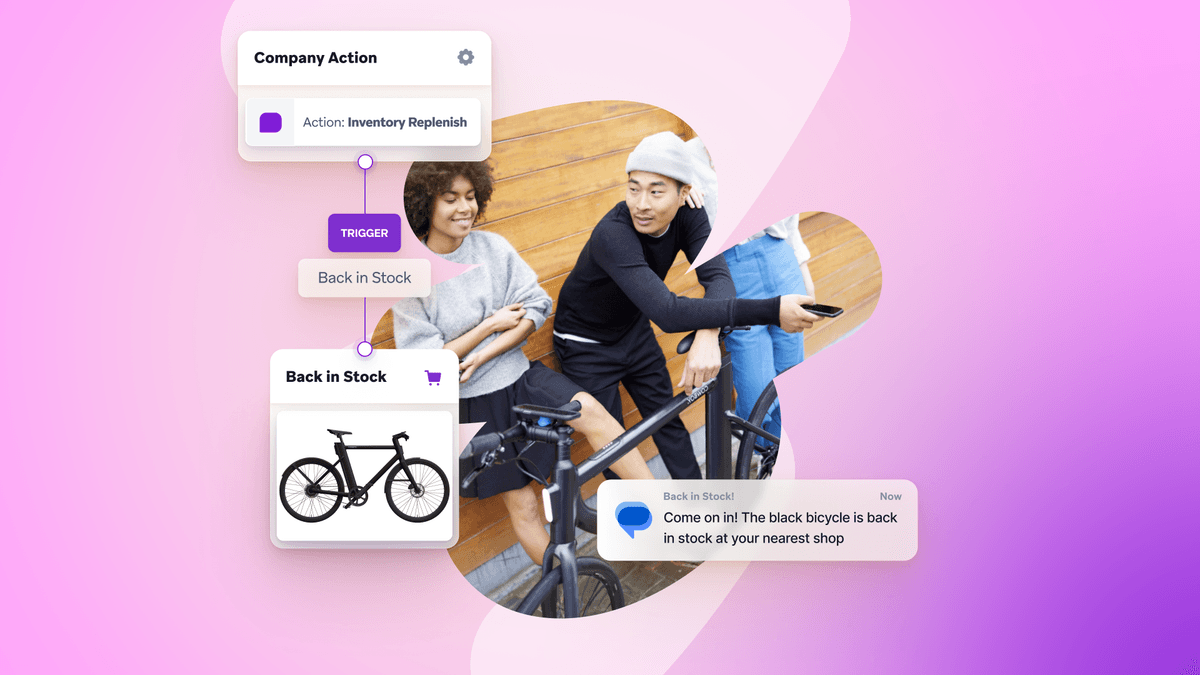
Action Paths
Map the most common paths users take—along with where they fall off. Action Paths automatically analyzes how people move through Canvas journeys and flags moments of friction or drop-off. That means less guesswork and faster optimization across channels.
Reporting and analytics
Track performance in real time across campaigns, channels, and variants. Braze Reporting and Analytics gives teams the tools to measure funnel performance, retention impact, and conversion lift—all from customizable, marketer-friendly dashboards.
Journey orchestration
With Braze, analytics doesn’t sit in a silo. Event data, segmentation, message logic, and reporting are all part of the same system. That means less delay, fewer disconnected tools, and more control over how journeys unfold.
Comparing top customer journey analytics software
Customer journey analytics tools come in all shapes, and sizes. Some offer complex dashboards built for data science teams. Others are lightweight add-ons bolted onto CRMs or campaign tools. But when it comes to turning insight into action, the differences matter.
Enterprise analytics platforms
These tools are often built for analysts, not marketers. They offer deep data exploration and custom modeling—but usually require technical expertise, manual setup, and separate tools for message orchestration. Insights are powerful, but slow to activate.
Experience and feedback platforms
Some tools focus on collecting sentiment and feedback across the customer lifecycle. They’re great for understanding perception and satisfaction, but they don’t typically offer campaign execution or real-time testing within the same system.
Marketing automation suites with analytics add-ons
Many marketing platforms offer basic journey visualizations or funnel tracking, but those features are often layered on top of older infrastructure. Real-time insights, testing flexibility, and cross-channel coordination can be limited.
Purpose-built engagement platforms
Platforms built for real-time engagement combine journey analytics, orchestration, and reporting in a single system. They help marketers understand what’s happening and act on it immediately—without jumping between tabs or waiting for reports.
Final thoughts on customer journey analytics
Customer journey analytics isn’t just a reporting layer—it’s a way to understand what your audience needs in the moment and respond with purpose. When data, orchestration, and messaging live in the same platform, teams can move faster, test smarter, and build experiences that reflect how people behave.
Whether you're aiming to reduce churn, improve lifetime value, or create more connected campaigns, journey analytics gives you the visibility—and the control—you need to do it better.
Customer journey analytics FAQs
What is customer journey analytics?
Customer journey analytics describe the process of tracking, analyzing, and understanding how individuals interact with a brand across channels and touchpoints over time. It helps teams optimize messaging, timing, and overall experience based on real behavior.
How is journey analytics different from customer journey mapping?
Journey analytics uses real-time data to show how people actually move through experiences. Customer journey mapping, on the other hand, is a planning exercise that outlines an idealized version of the customer experience—usually without live data.
What are the top tools for customer journey analytics?
The top customer journey analytics tools are those that combine real-time data, cross-channel insights, and built-in orchestration. Look for platforms that support behavioral tracking, reporting, and activation—all in one place.
How can I use analytics to improve customer retention and engagement?
You can use customer journey analytics to identify drop-off points, test new messaging strategies, personalize touchpoints, and respond to behavior as it happens. These insights help you build more relevant, timely, and connected experiences that keep customers engaged.
What KPIs should I track in a customer journey analytics strategy?
Track KPIs like time to convert, retention rate, drop-off points, channel-specific engagement, and customer lifetime value. These metrics help you understand the effectiveness of your journeys and where to optimize next.
Related Tags
Be Absolutely Engaging.™
Sign up for regular updates from Braze.
Related Content
 Article13 min read
Braze vs Salesforce: Which customer engagement platform is right for your business?
February 19, 2026 Article18 min read
Braze vs Adobe: Which customer engagement platform is right for your brand?
February 19, 2026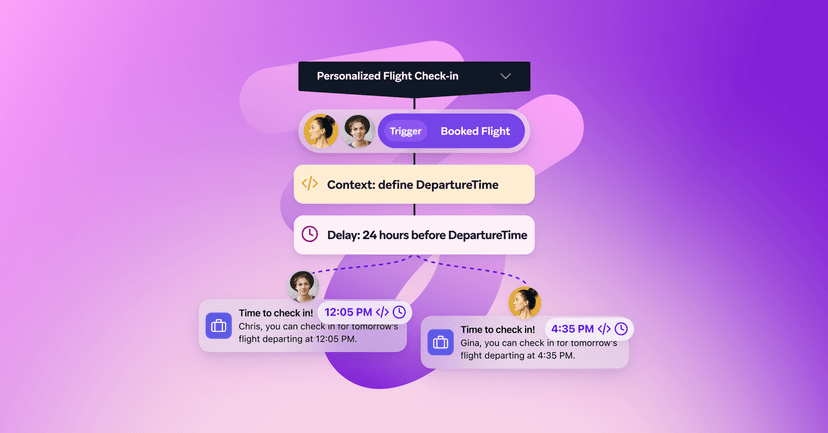 Article7 min read
Every journey needs the right (Canvas) Context
February 19, 2026