10 essential mobile app metrics and engagement KPIs (and how to use them)
Published on June 05, 2025/Last edited on November 11, 2025/12 min read

Team Braze
Mobile apps don’t succeed by downloads alone. To grow and retain users, marketers need a clear, ongoing view of what’s working, what’s not and where to optimize. But with so many mobile app metrics available, all that data can lead to paralysis–there’s so much to leverage that figuring out what metrics really matter to your business can be exhausting, time-consuming and overwhelming. That’s why focusing on the right mobile application KPIs is key to building a strategy that actually drives results.
Luckily, we’re here to help. In this guide, we’ll walk through the top 10 mobile application KPIs to track, from DAU and churn rate to push opt-ins and session length. We’ll also explore how to interpret each metric, connect it to your consumer engagement strategy and turn numbers into outcomes using the Braze platform.
Here’s what to expect:
- What are mobile application KPIs (and why do they matter)?
- 10 essential app metrics to track for growth and retention
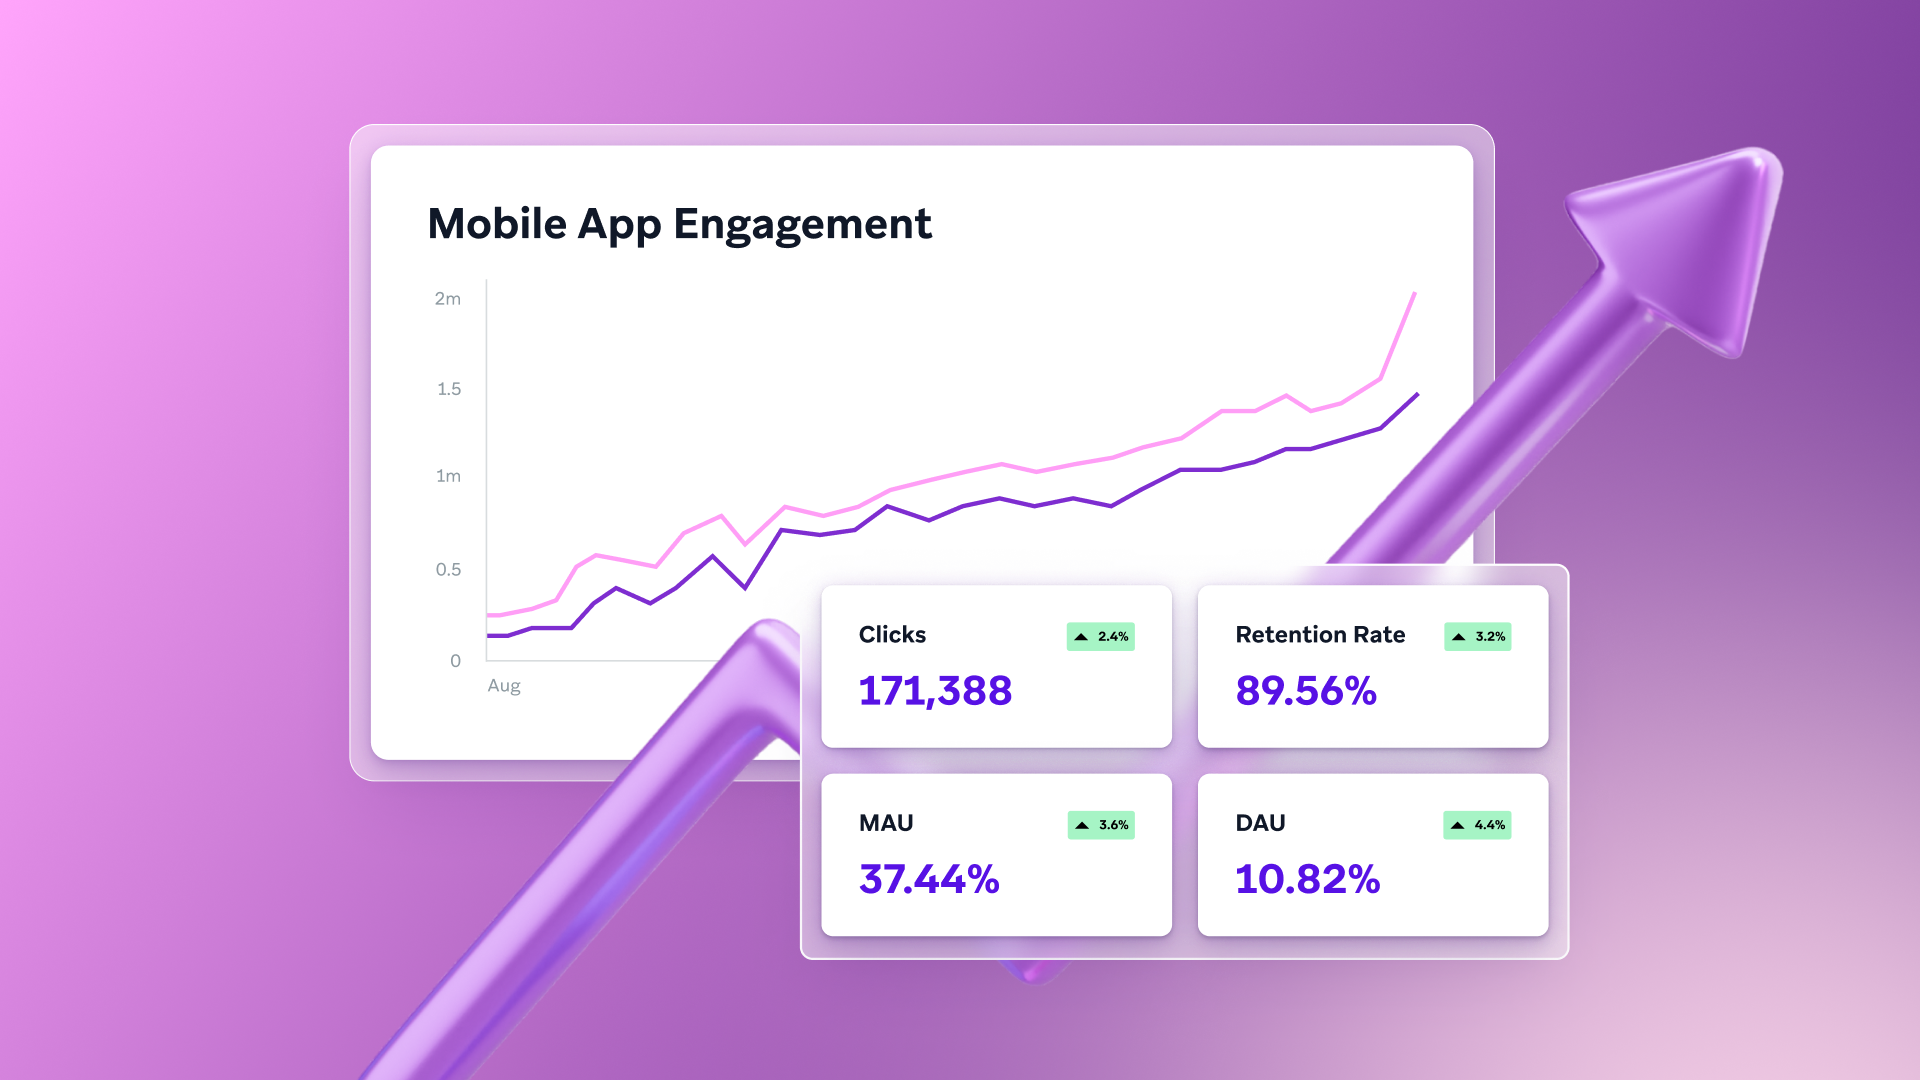
- Daily active users (DAU) and monthly active users (MAU)
- Churn rate and uninstall tracking
- Retention rate
- Session length and session interval
- Push notification opt-in rate
- Push notification click-through rate (CTR)
- In-app message conversion rate
- Feature adoption rate
- Lifetime value (LTV)
- Average revenue per user (ARPU)
- How to act on app metrics using Braze
- FAQs for Mobile app metrics and Engagement KPIs
What are mobile application KPIs (and why do they matter)?
Mobile application KPIs are the metrics that help marketers understand how users interact with their app and whether those experiences lead to long-term value. These indicators help show which strategies are working and where to improve.
10 essential app metrics to track for growth and retention
These ten app metrics to track offer a clearer picture of how your users behave, where engagement is strong, and where there’s room to improve. From activation to lifetime value, each one plays a role in helping you build a healthier, more effective mobile strategy.
1. Daily active users (DAU) and monthly active users (MAU)
Daily and monthly active users are two of the clearest indicators of app health and among the most essential app metrics to track. Together, they show how many people are engaging and how often.
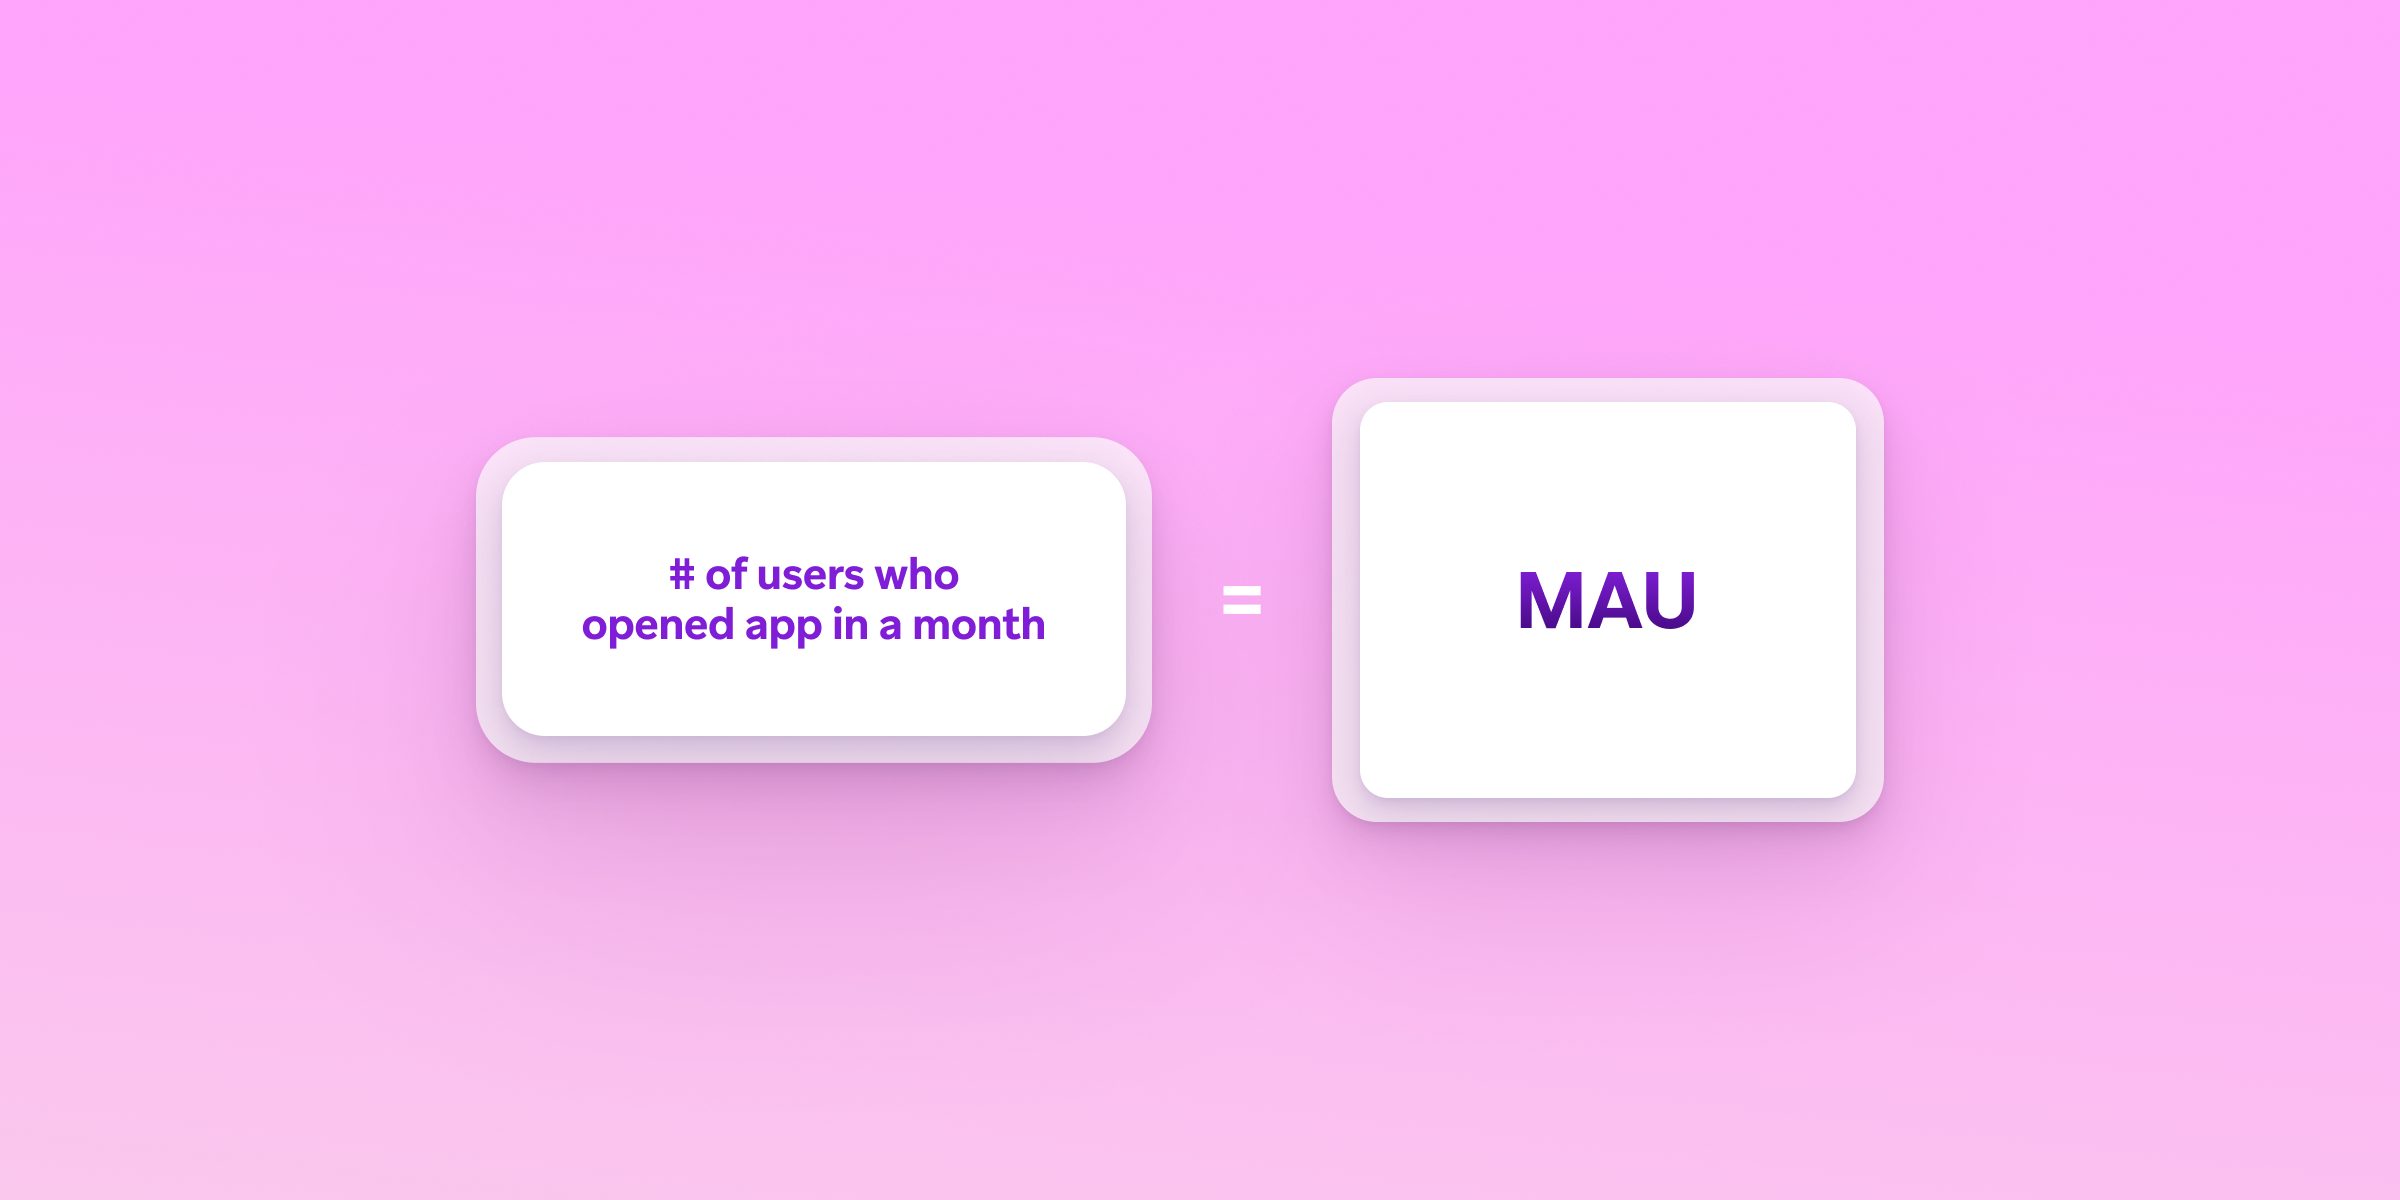
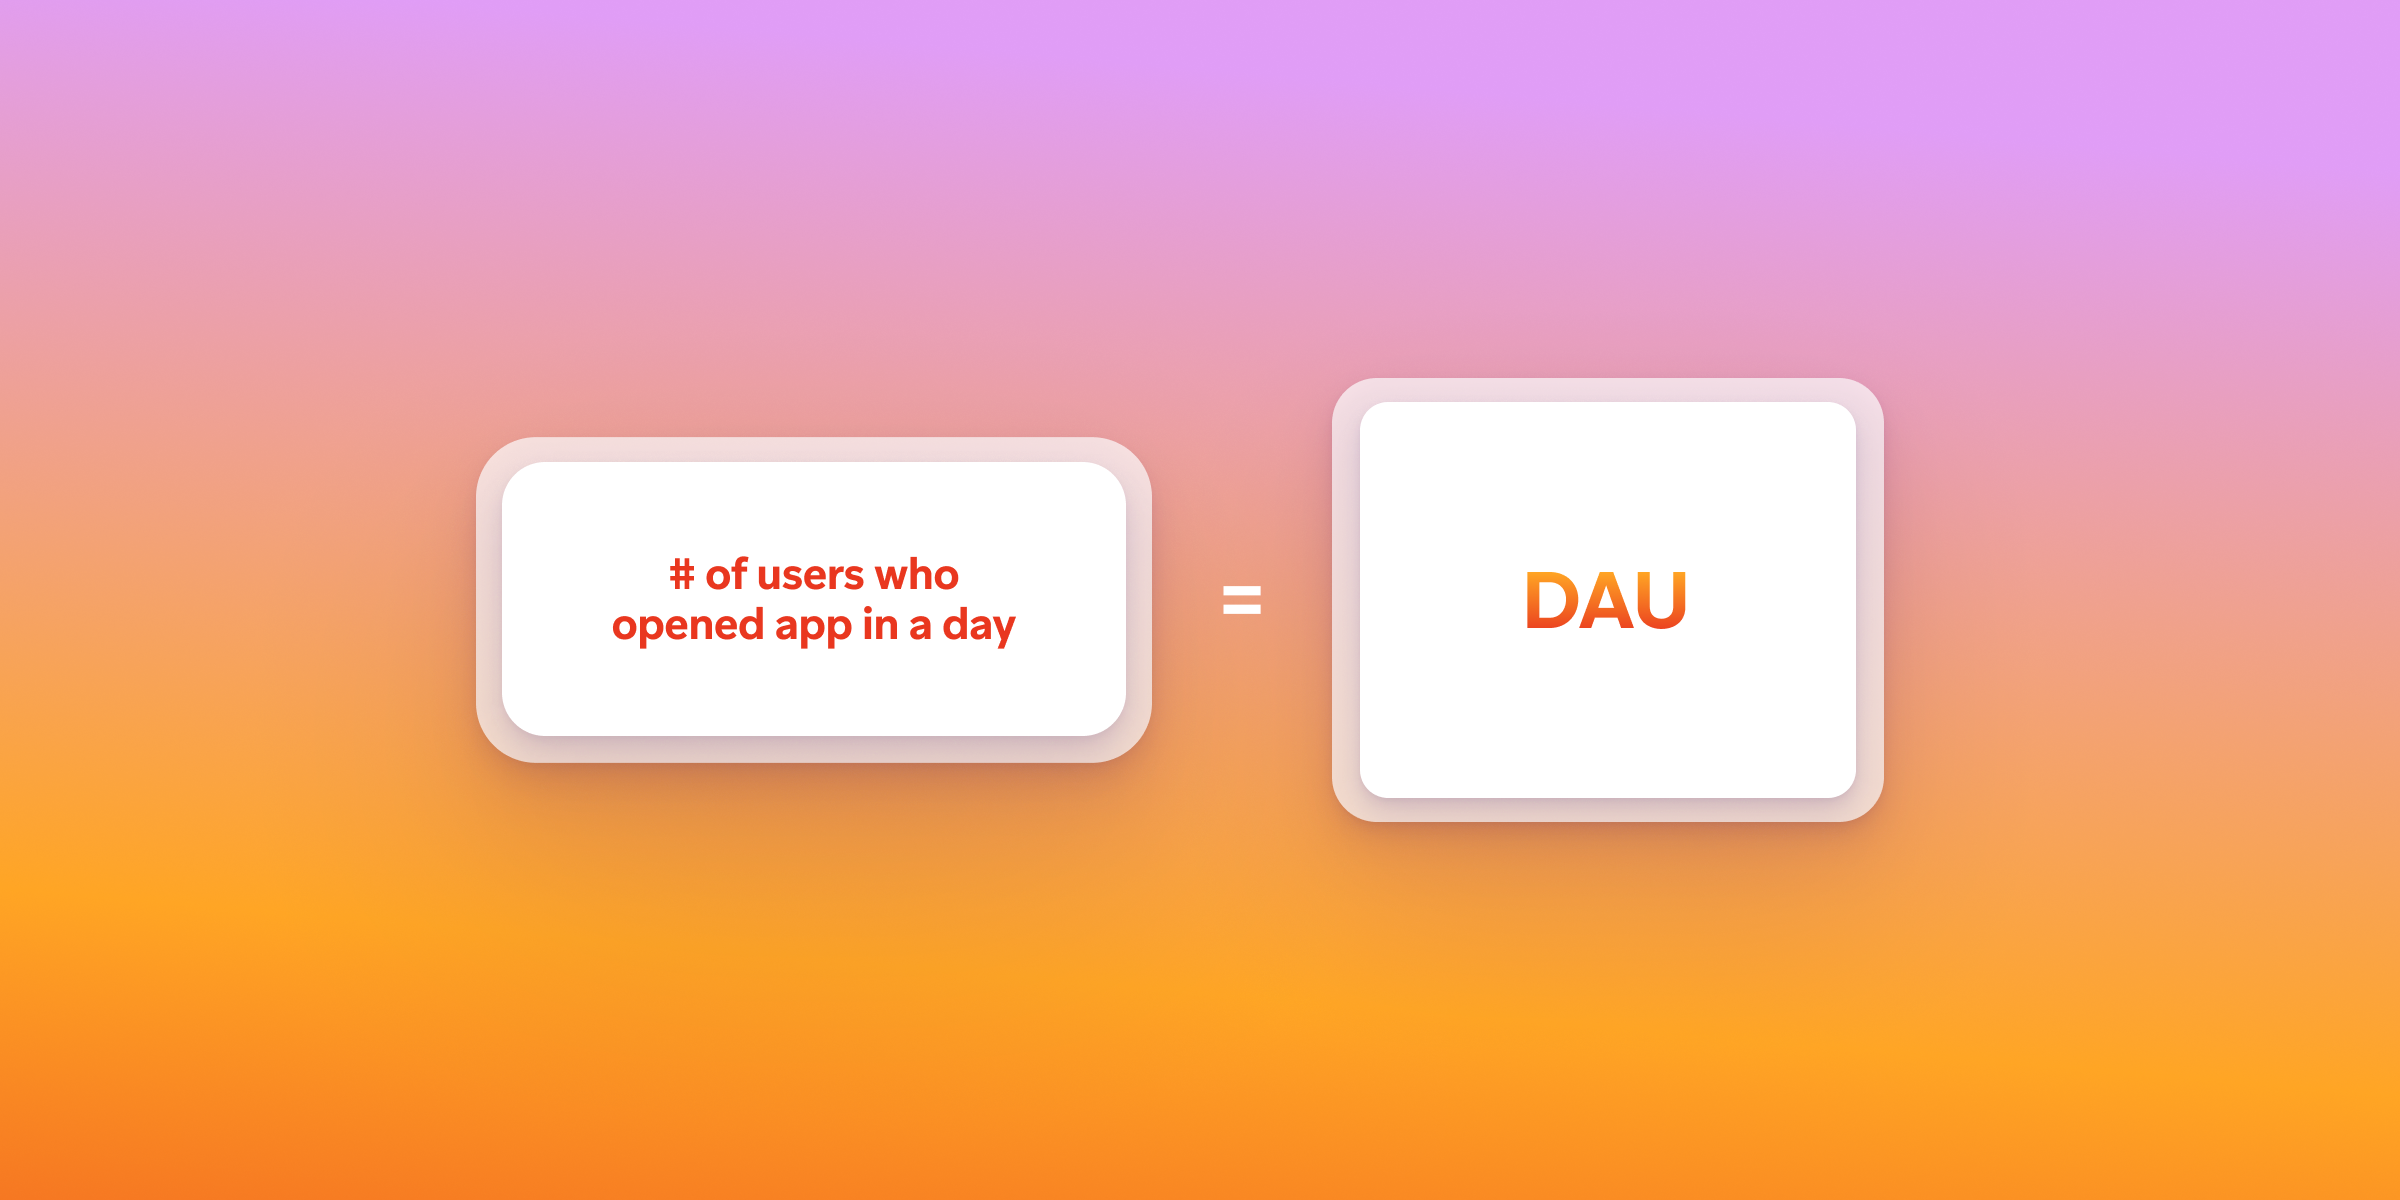
- DAU = the number of unique users who engage with your app on a given day
- MAU = the number of unique users who engage with your app over a 30-day period
- DAU/MAU ratio = a measure of stickiness
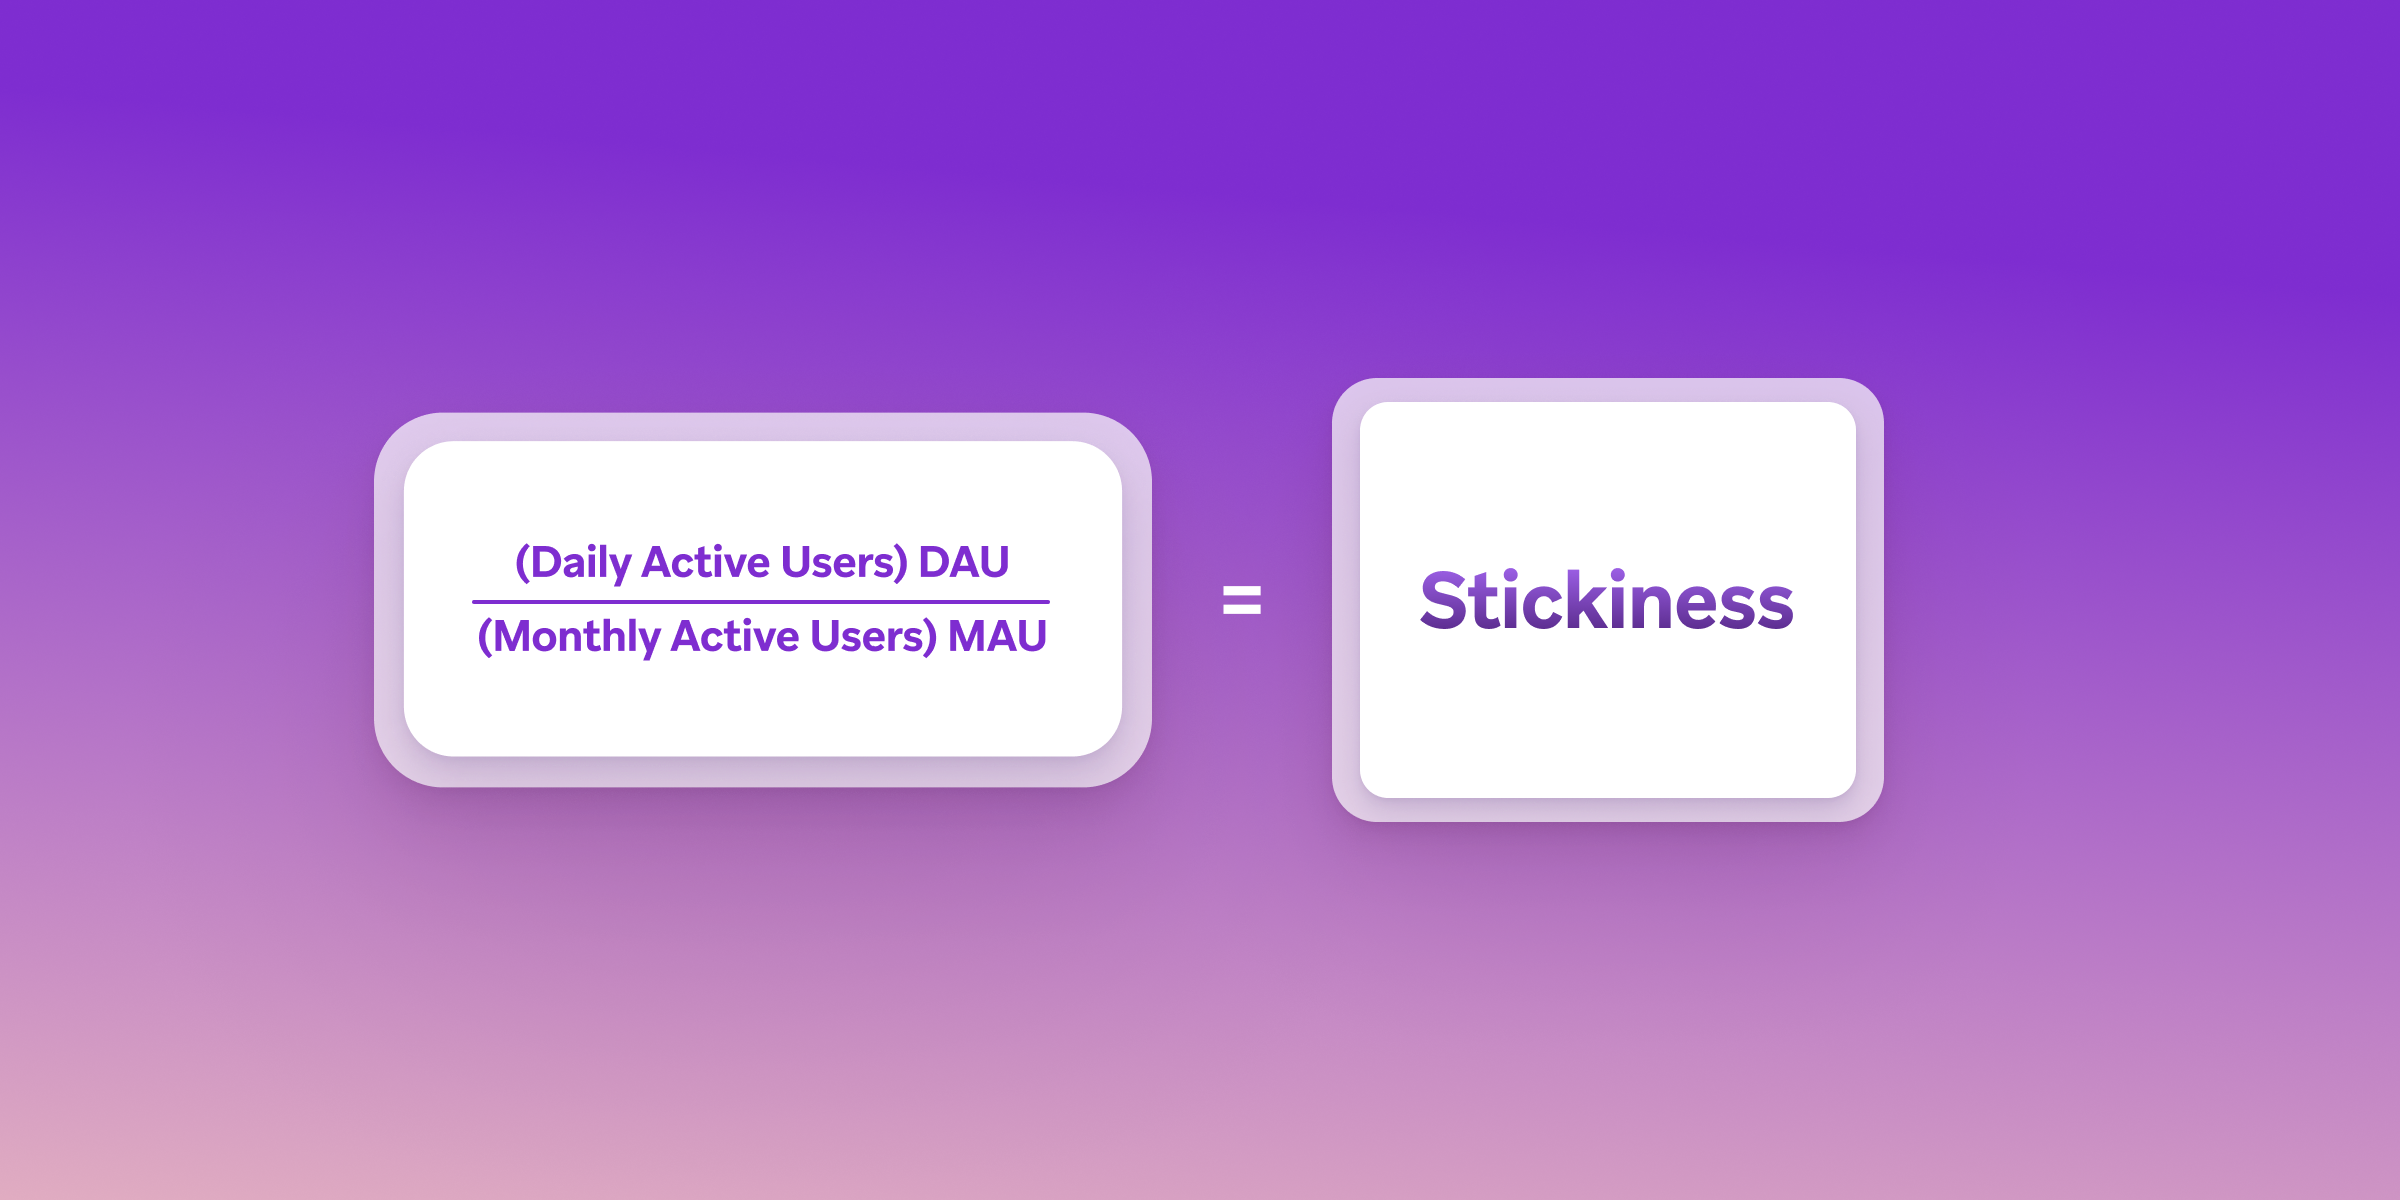
A strong DAU/MAU ratio points to habitual usage, while a low one can be an early warning sign of churn or weak product-market fit. Tracking this data over time can help brands spot patterns, segment loyal vs. one-time users, and test new ways to keep people coming back.
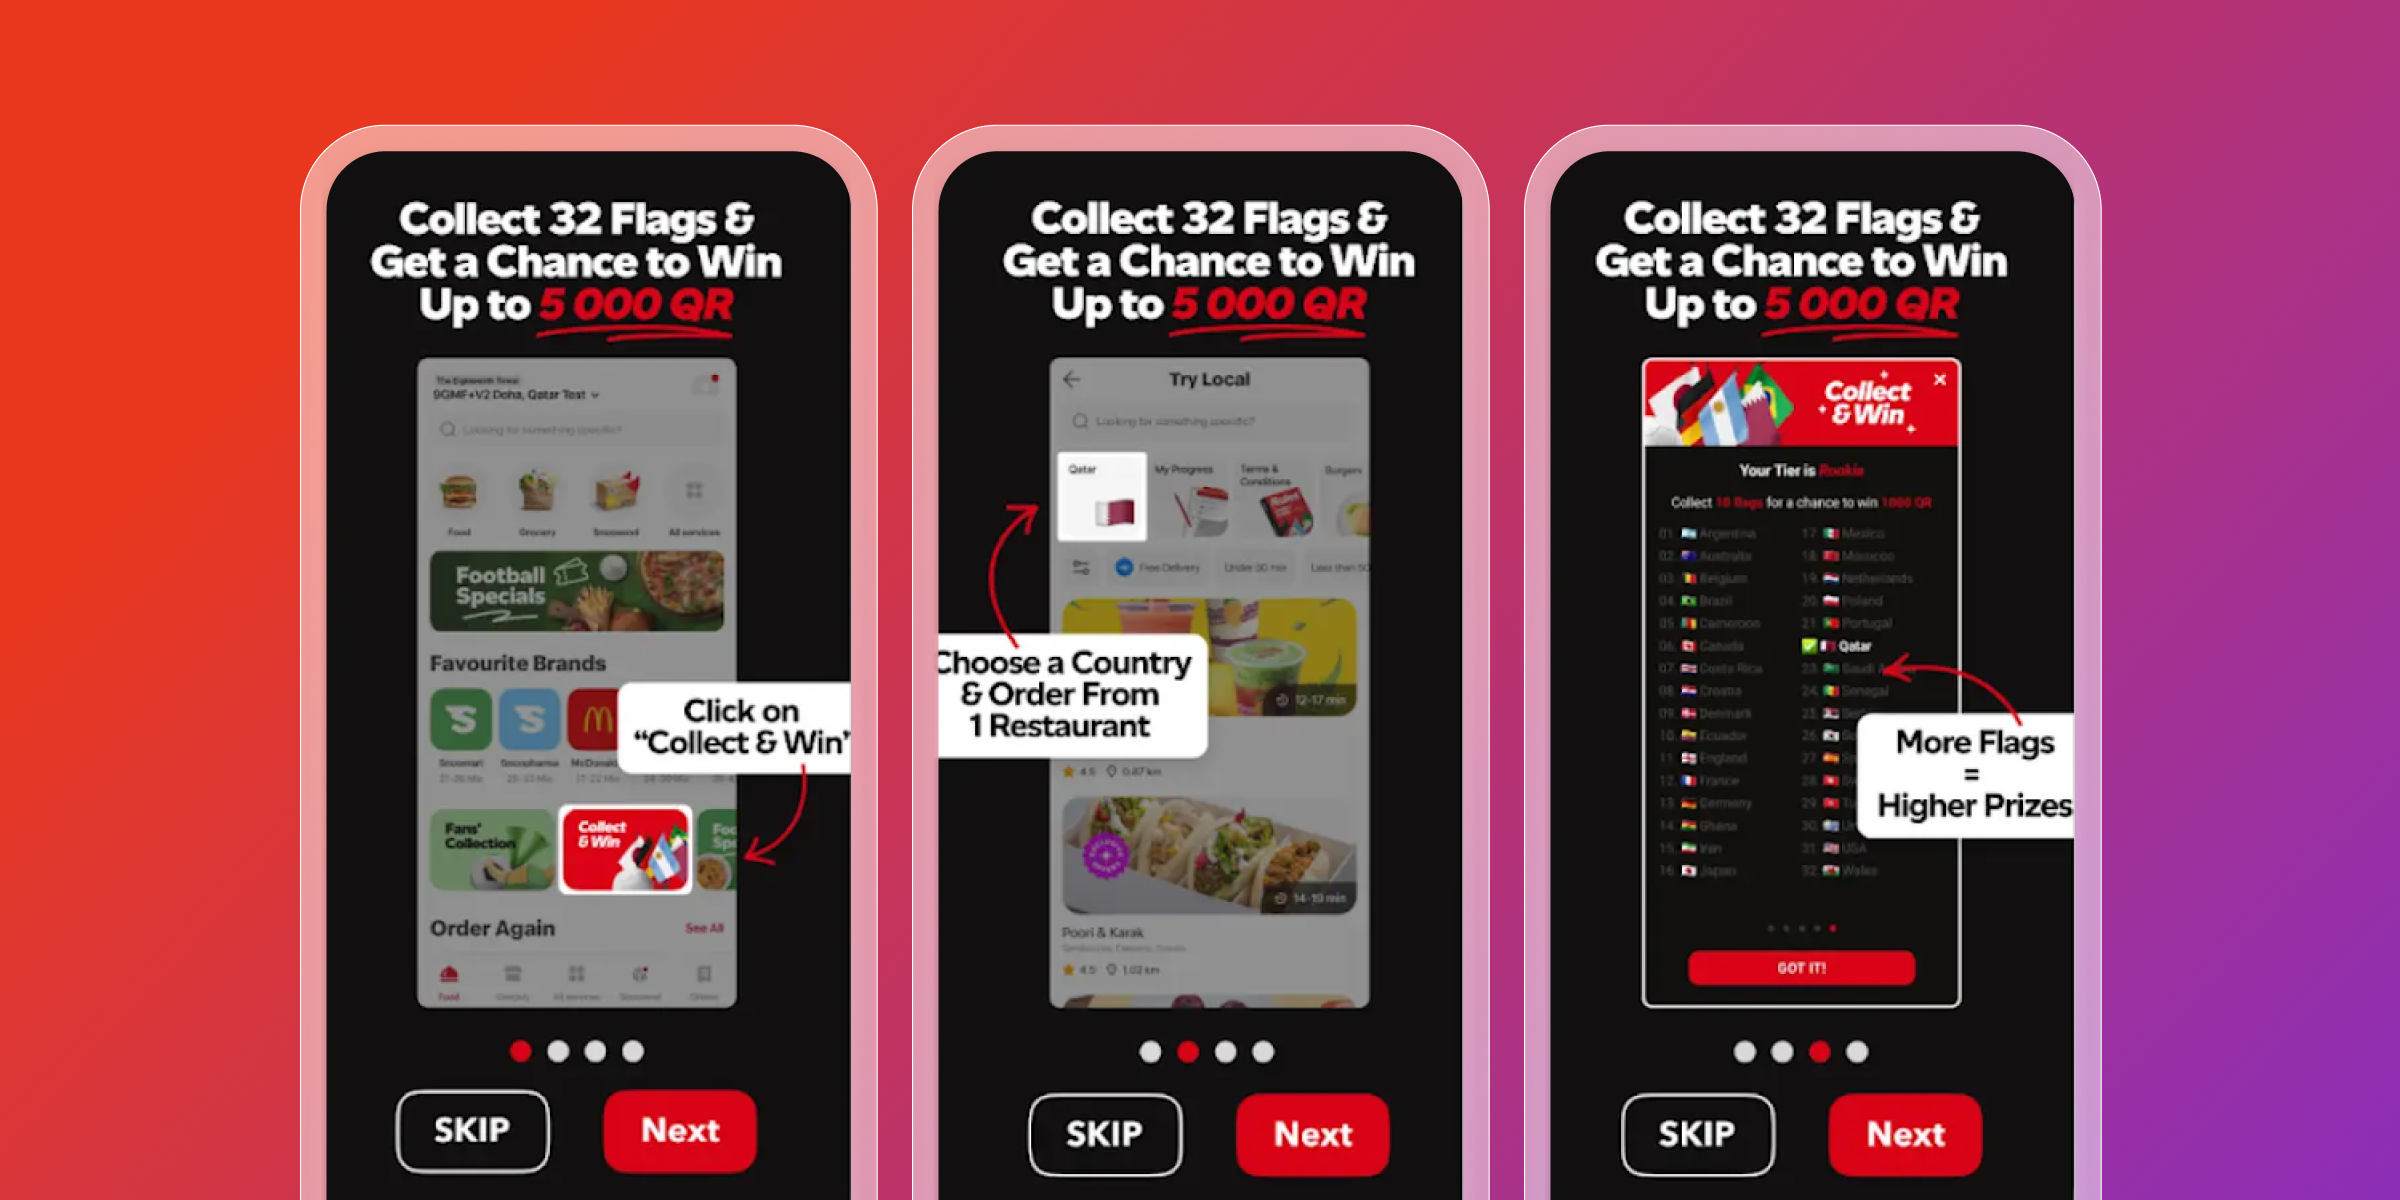
Real-life example: Second Dinner turned DAU tracking into daily loyalty
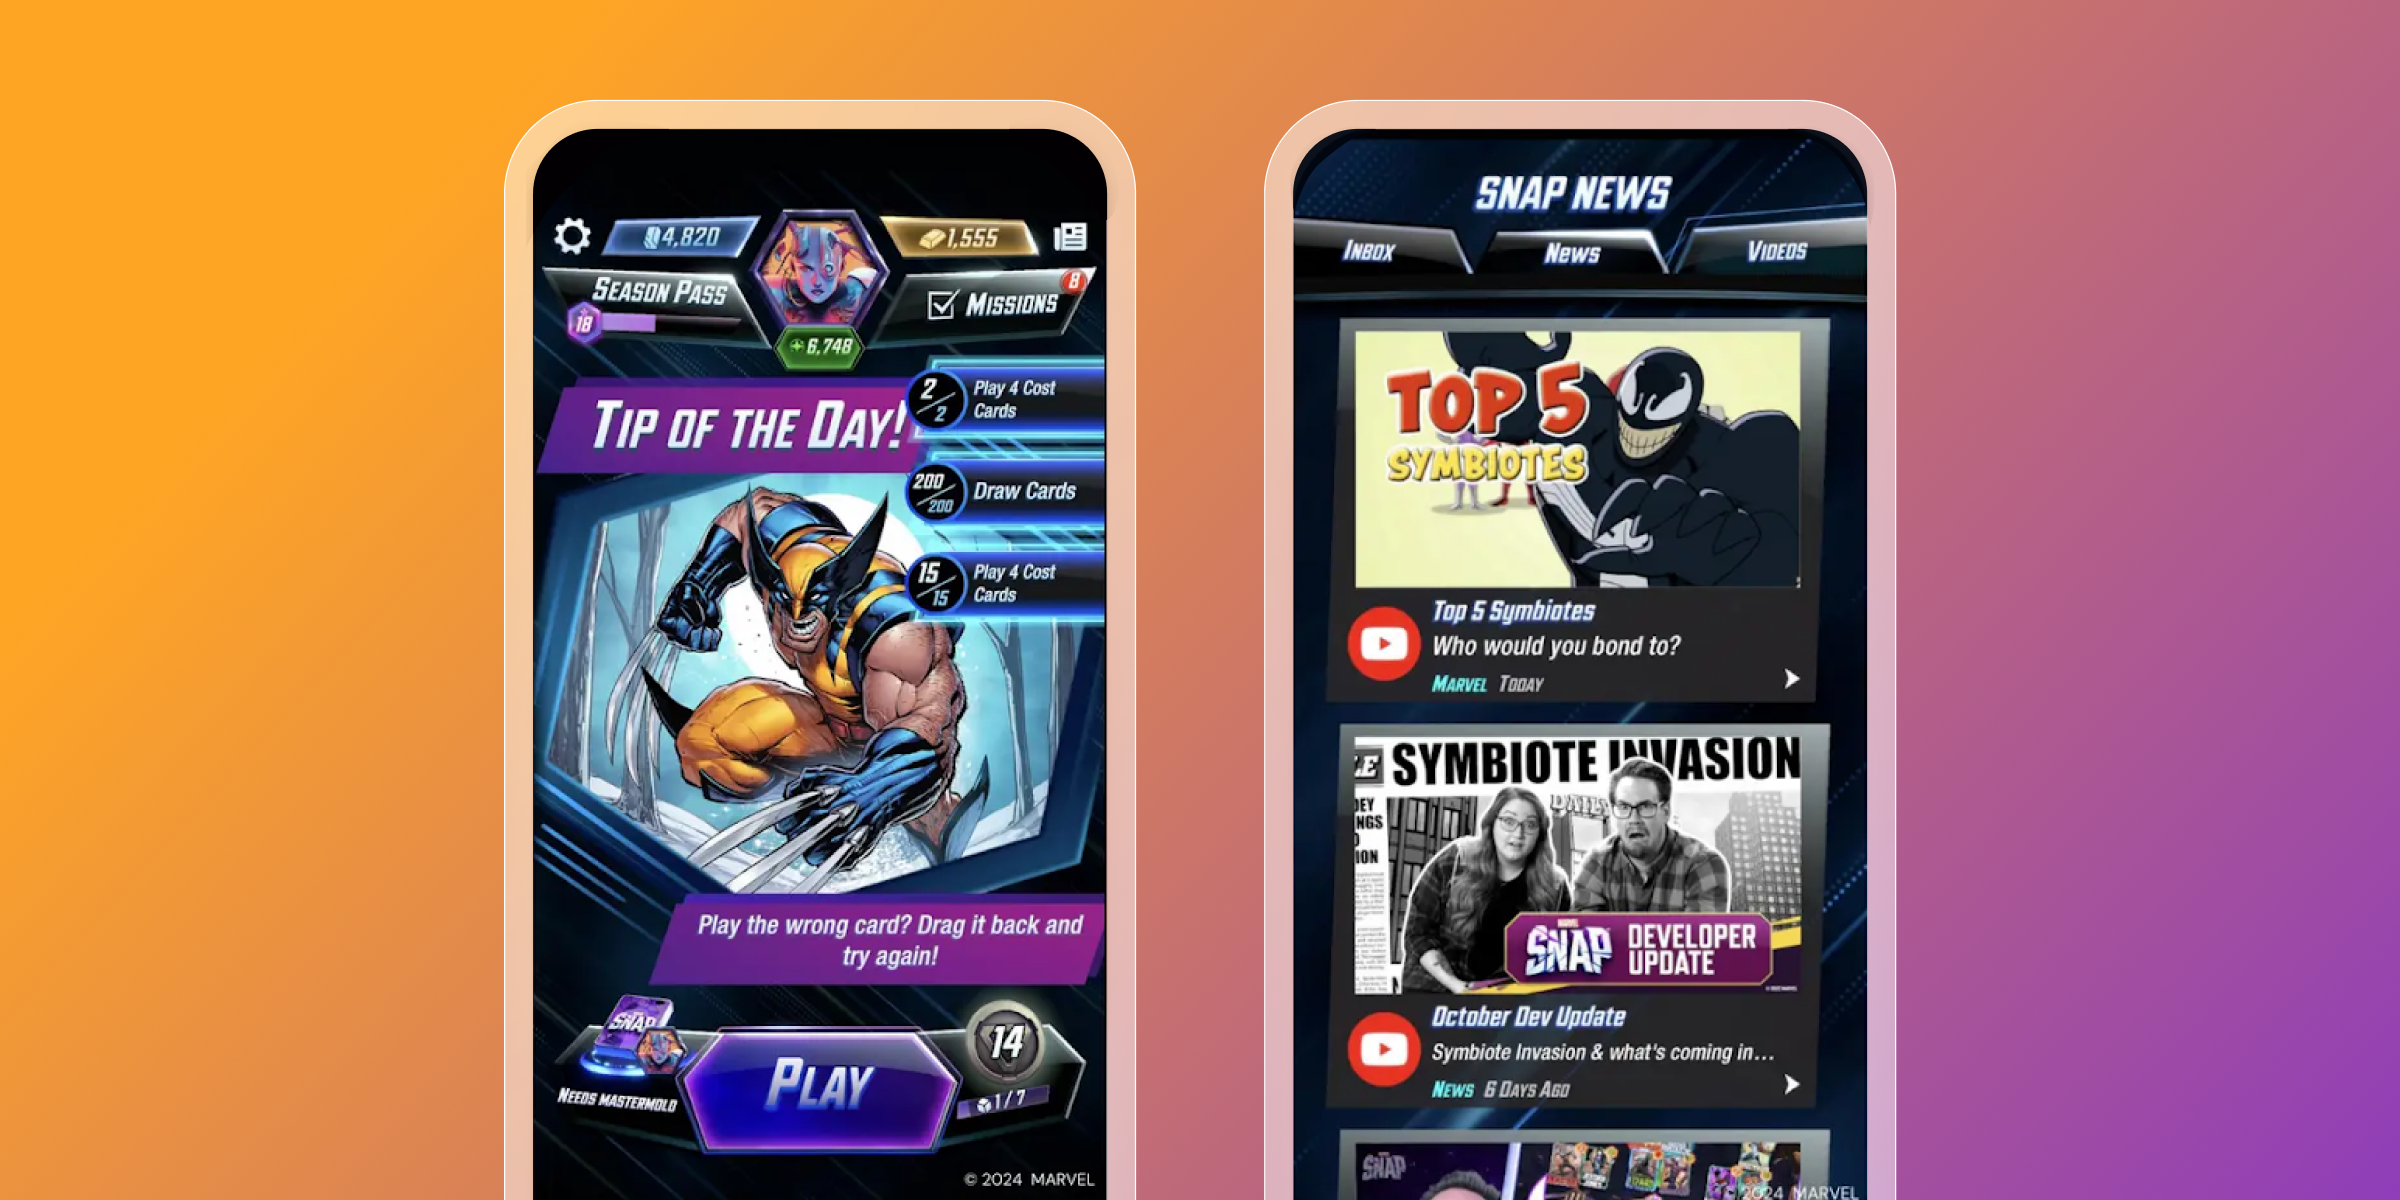
To grow their MARVEL SNAP player base, game development studio, Second Dinner, monitored daily active users (DAU) as a key engagement KPI. But they didn’t stop at reporting. Using Braze Canvas, our no-code journey orchestration tool, the team built journeys triggered by player behavior, nudging users back into the game with personalized, relevant messaging. By acting on DAU data and continually refining it, instead of just tracking it, they boosted daily engagement and strengthened player retention.
2. Churn rate and uninstall tracking
Churn rate measures how many users stop engaging with your app over time, or worse, remove it. It’s a key signal of whether your product and messaging are keeping users interested or letting them slip away.
- Churn rate = (Users lost during a period / users at the start of the period) × 100
- Uninstall rate = % of users who delete your app
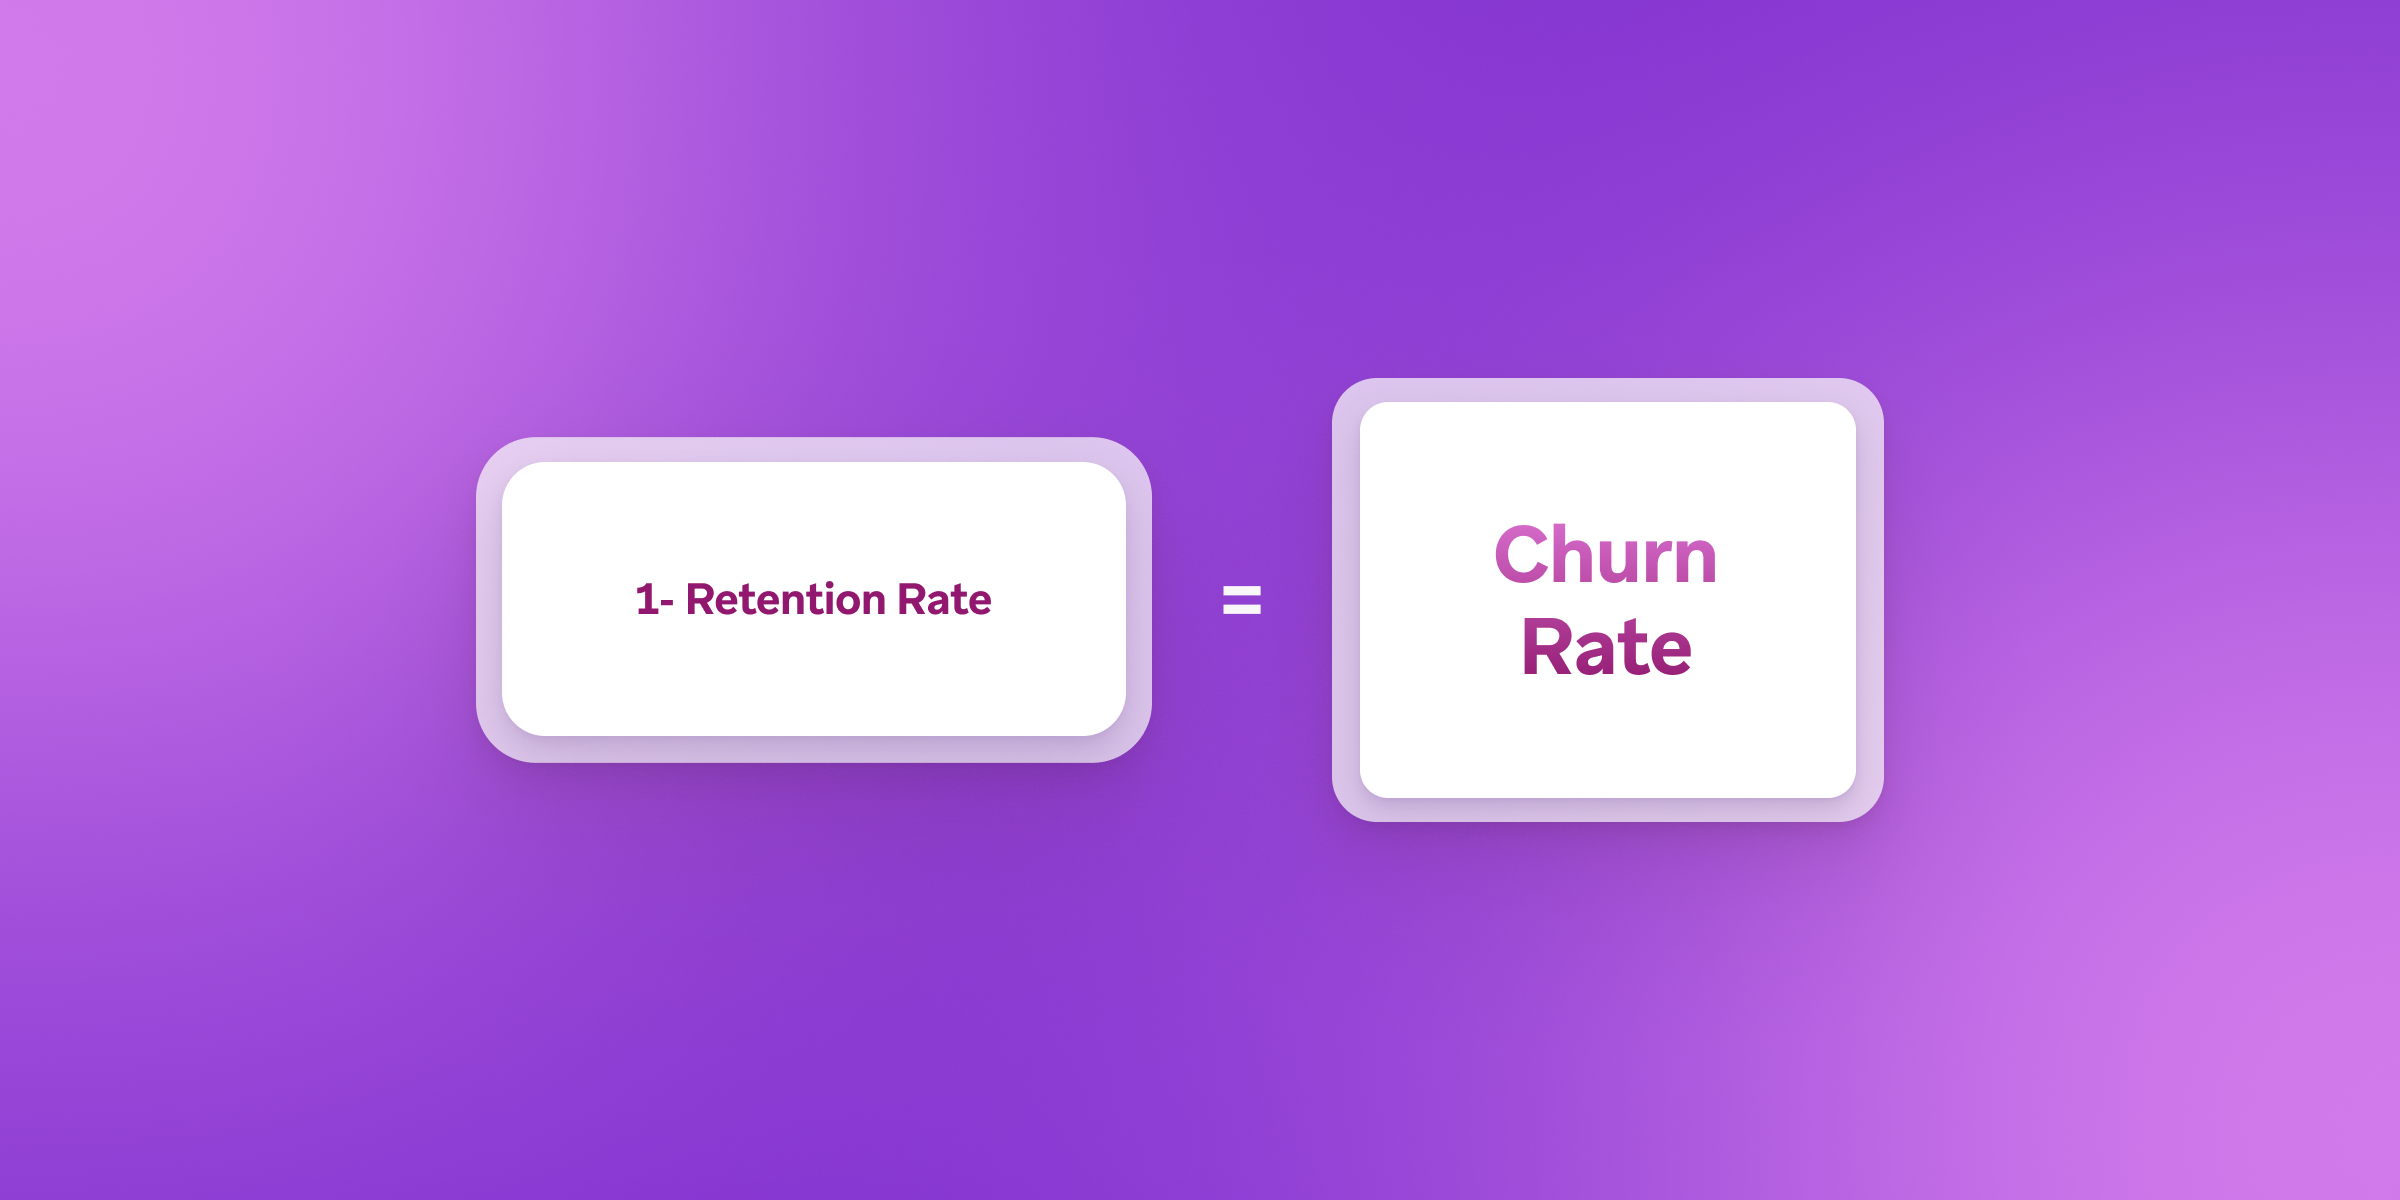
Together, these metrics help marketers help identify when and why users drop off. But the real value comes from acting on that insight, before the user is gone for good. To help combat churn, teams can use churn signals to build high-risk segments and trigger automated re-engagement flows. Want to learn more? Dig deeper into uninstall tracking.
Real-life example: Too Good To Go used churn data to rebuild loyalty
When sustainability app Too Good To Go spotted early churn patterns, they didn’t wait to react., The team identified drop-off points and reactivated lapsed users with timely, relevant outreach. By turning uninstall and inactivity signals into targeted messaging, they saw a meaningful lift in retention and user satisfaction.
Explore Too Good To Go's full story
3. Retention rate
Retention rate shows how many users return to your app over a set amount of time. It’s one of the most important mobile engagement KPIs because if users don’t stick around, nothing else matters.
- Day 1 retention = % of users who return the day after installing
- Day 7 and Day 30 retention = longer-term health indicators
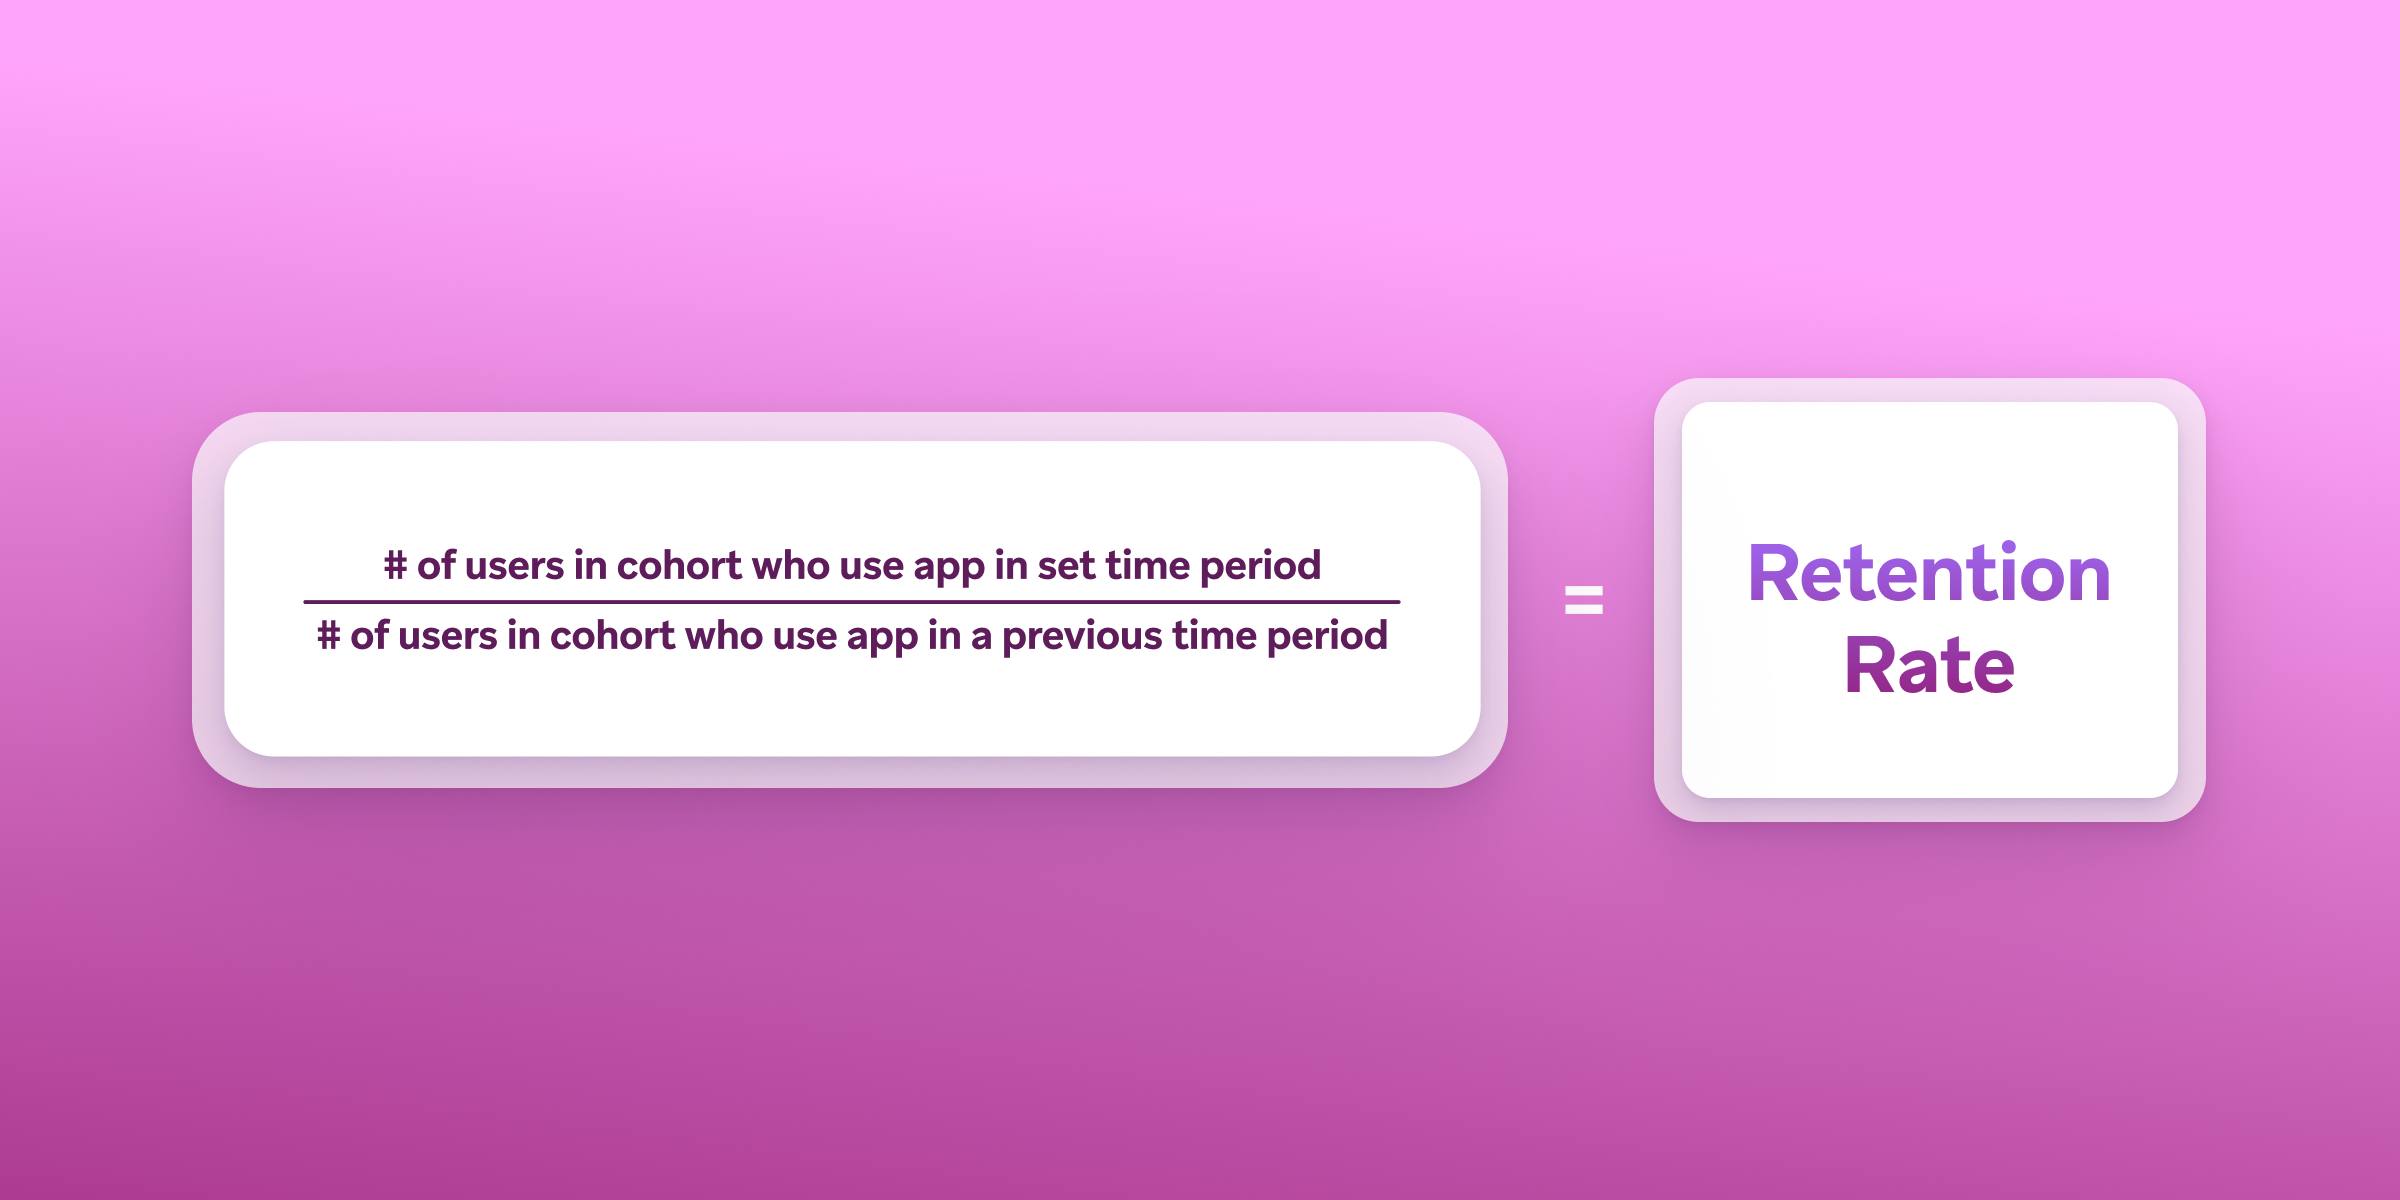
Improving retention means reinforcing value at the right time. That could mean a reminder message, a personalized tip, or a reactivation campaign triggered by inactivity.
Real-life example: Snoonu used retention data to personalize re-engagement
Delivery app Snoonu saw retention as a growth lever. With Braze, they tracked returning users across key milestones, then used that insight to build dynamic re-engagement flows. By sending the right message at the right moment, they lifted repeat usage and kept customers in the loop with what mattered most.
See how Snoonu drove stronger retention
4. Session length and session interval
Session metrics help you understand how users behave once they open your app by looking at the time spent during each session and how long it took them to come back for another.
- Session length = time spent per session
- Session interval = time between sessions
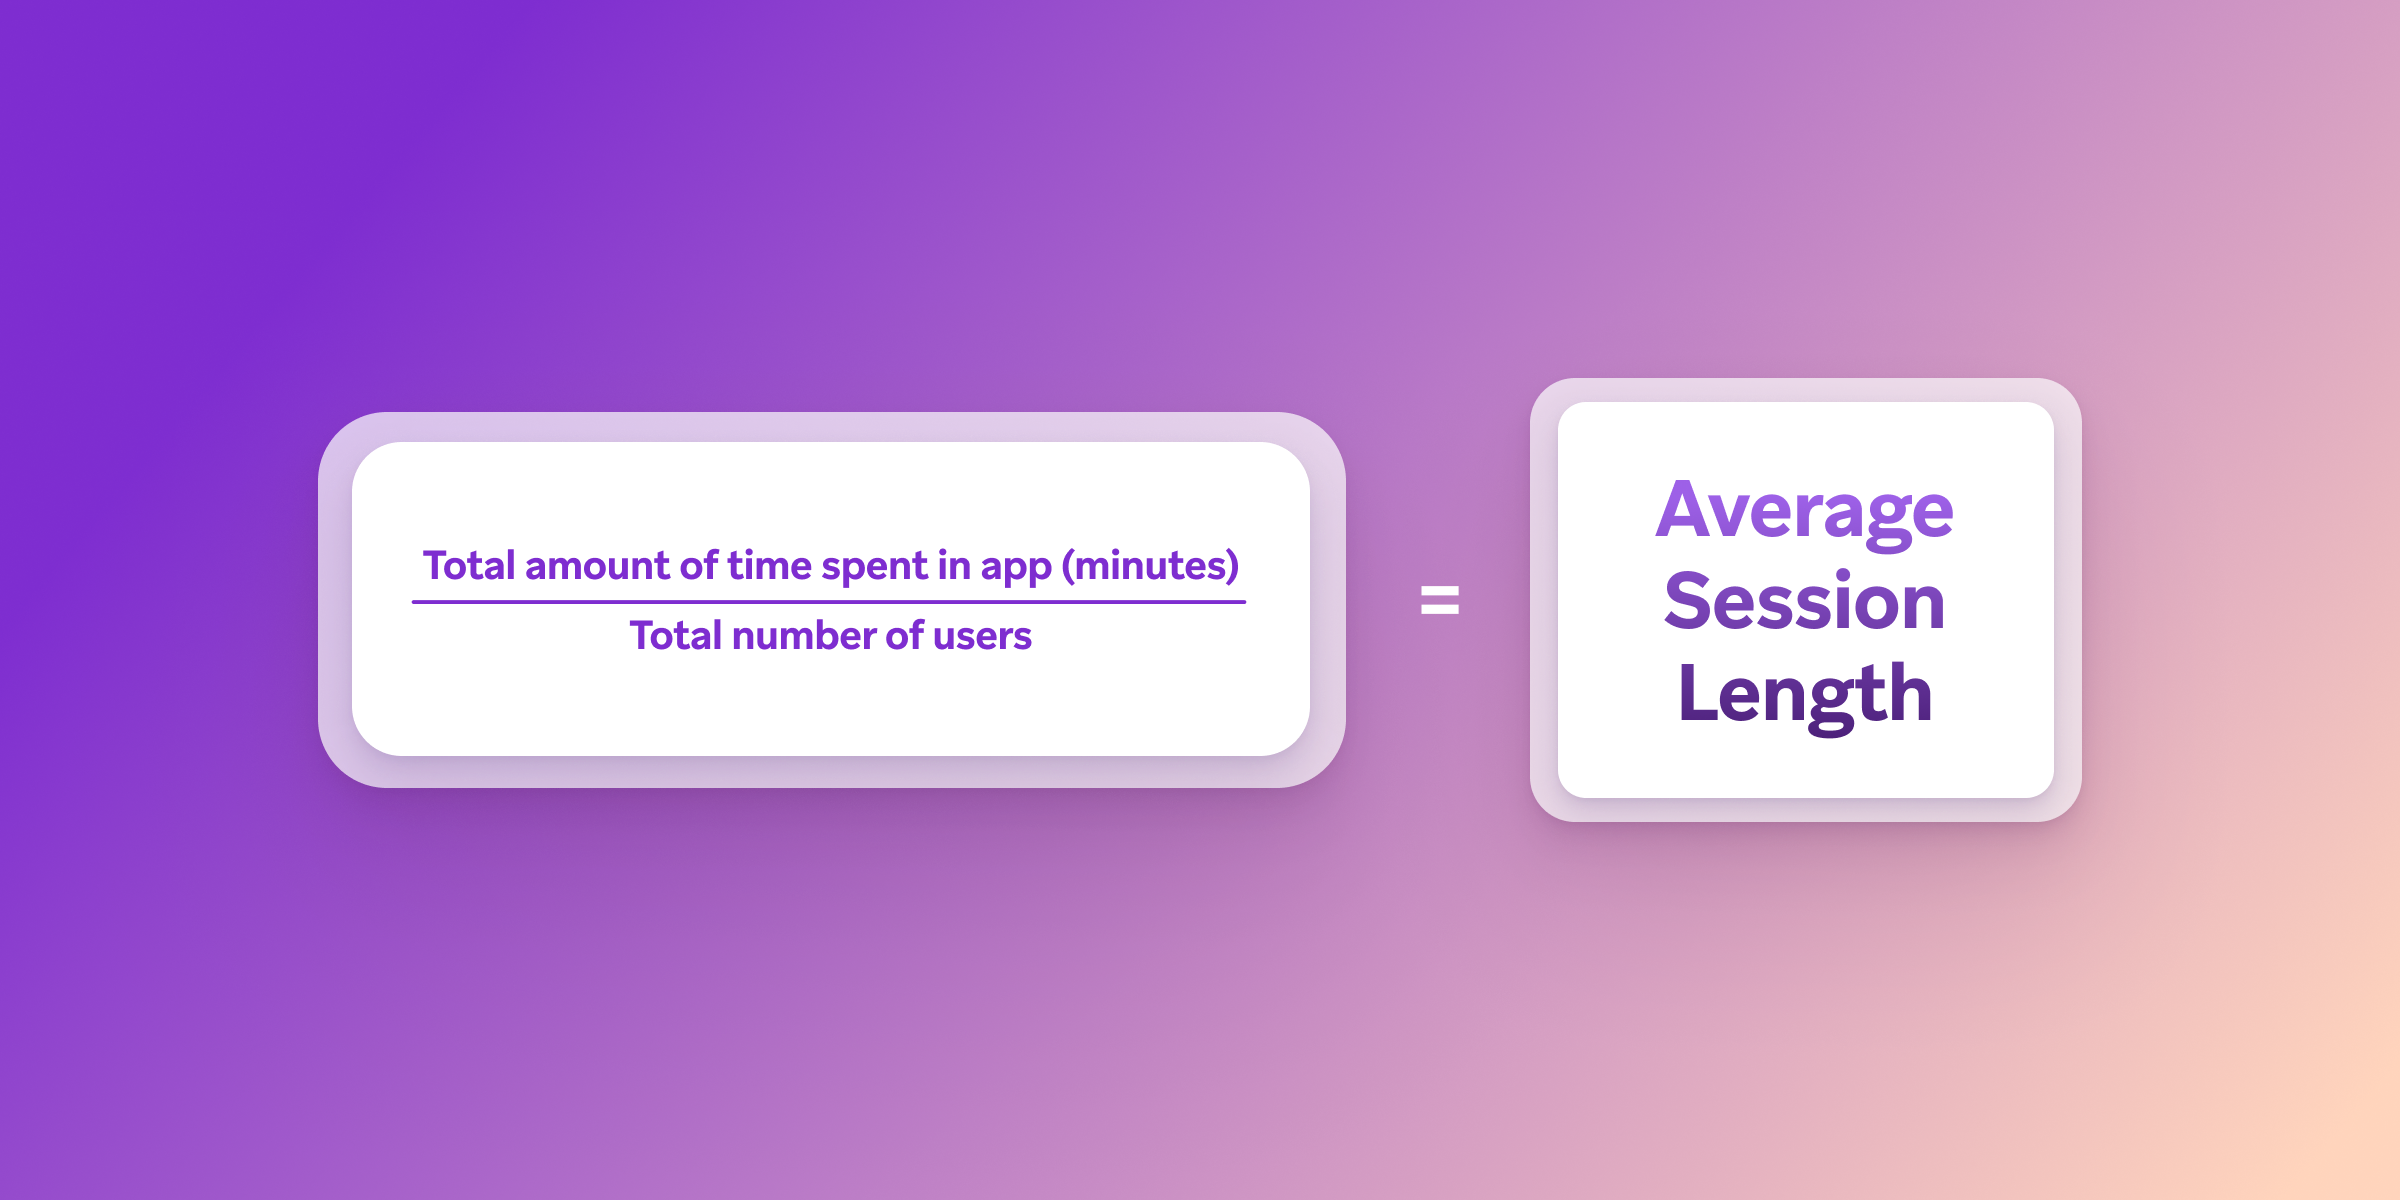
Longer or more regular sessions often signal deeper engagement or better UX. Shorter intervals suggest habit formation and app stickiness. These insights are especially valuable when used to build behavioral segments and guide message timing.
To improve, you can use session-based events to create tailored journeys, nudging users back when engagement drops, or rewarding frequent activity with personalized offers.
Real-life example: Grubhub set mobile application KPIs with behavioral insights to re-engage frequent users

Grubhub, a leading online and mobile food-ordering and delivery marketplace, tracked users’ in-app activity over the course of the year and used that data to launch a personalized “year in review” campaign via in-app messaging. By highlighting each user’s engagement milestones–from most-ordered dishes to total restaurant visits–they created a high-performing experience rooted in real usage patterns.
Take a closer look at Grubhub’s approach
5. Push notification opt-in rate
Push notifications are a powerful re-engagement tool–but only if users have opted in.
- Push opt-in rate = (Push-enabled users / total users) × 100
This metric tells you how many people are reachable through push messaging. A low opt-in rate can severely limit your campaign’s reach. Boosting opt-ins often comes down to value–make it clear, early on, why users should want to hear from you.
To increase your opt-in rate, marketers can create customized onboarding flows with contextual prompts that explain the benefits of opting in, plus easily A/B test channels and content to see what works best.
Learn more about push notification metrics
Real-life example: e.l.f. boosted opt-ins with personalized onboarding
Beauty brand e.l.f. used Braze to improve its push notification strategy from the start.
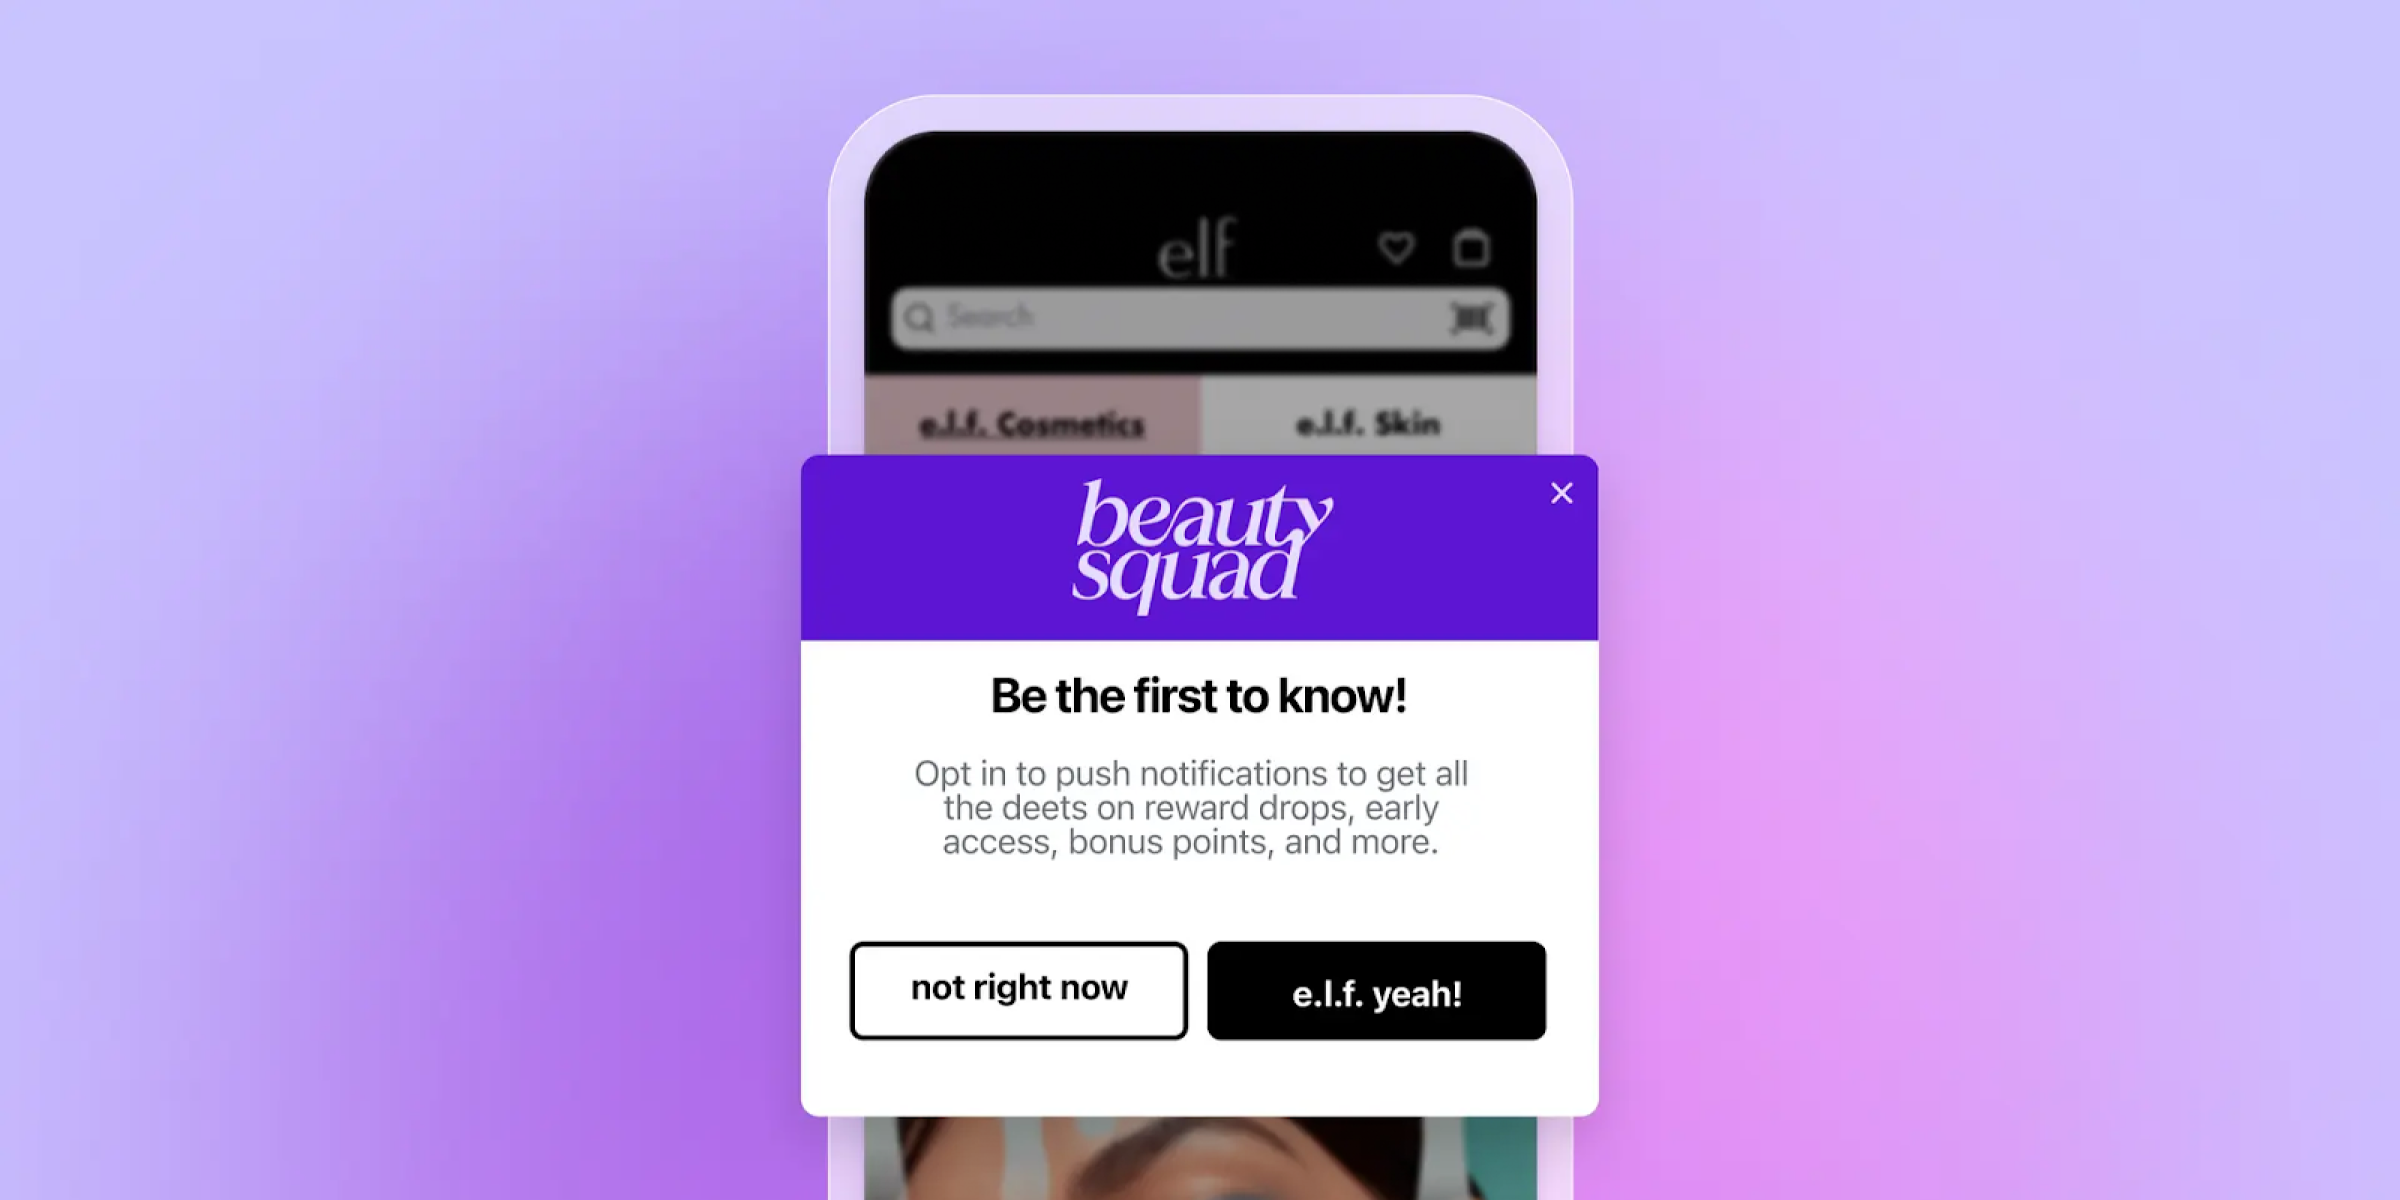
By integrating opt-in prompts into personalized onboarding flows and reinforcing the value of real-time updates, they lifted opt-in rates and unlocked stronger cross-channel performance.
Read how e.l.f. improved mobile engagement
6. Push notification click-through rate (CTR)
Click-through rate (CTR) measures how many users tap your push notification to open the app. It’s often a key signal of whether your message strategy is working.
- CTR = (Push opens / pushes delivered) × 100
Improve CTR by using dynamic personalization tools that let you tailor messages to each user and their behavior at scale. Run A/B and multivariate tests to see what resonates best with your audience, and adjust accordingly.
Real-life example: Styli boosted CTR with personalized push campaigns
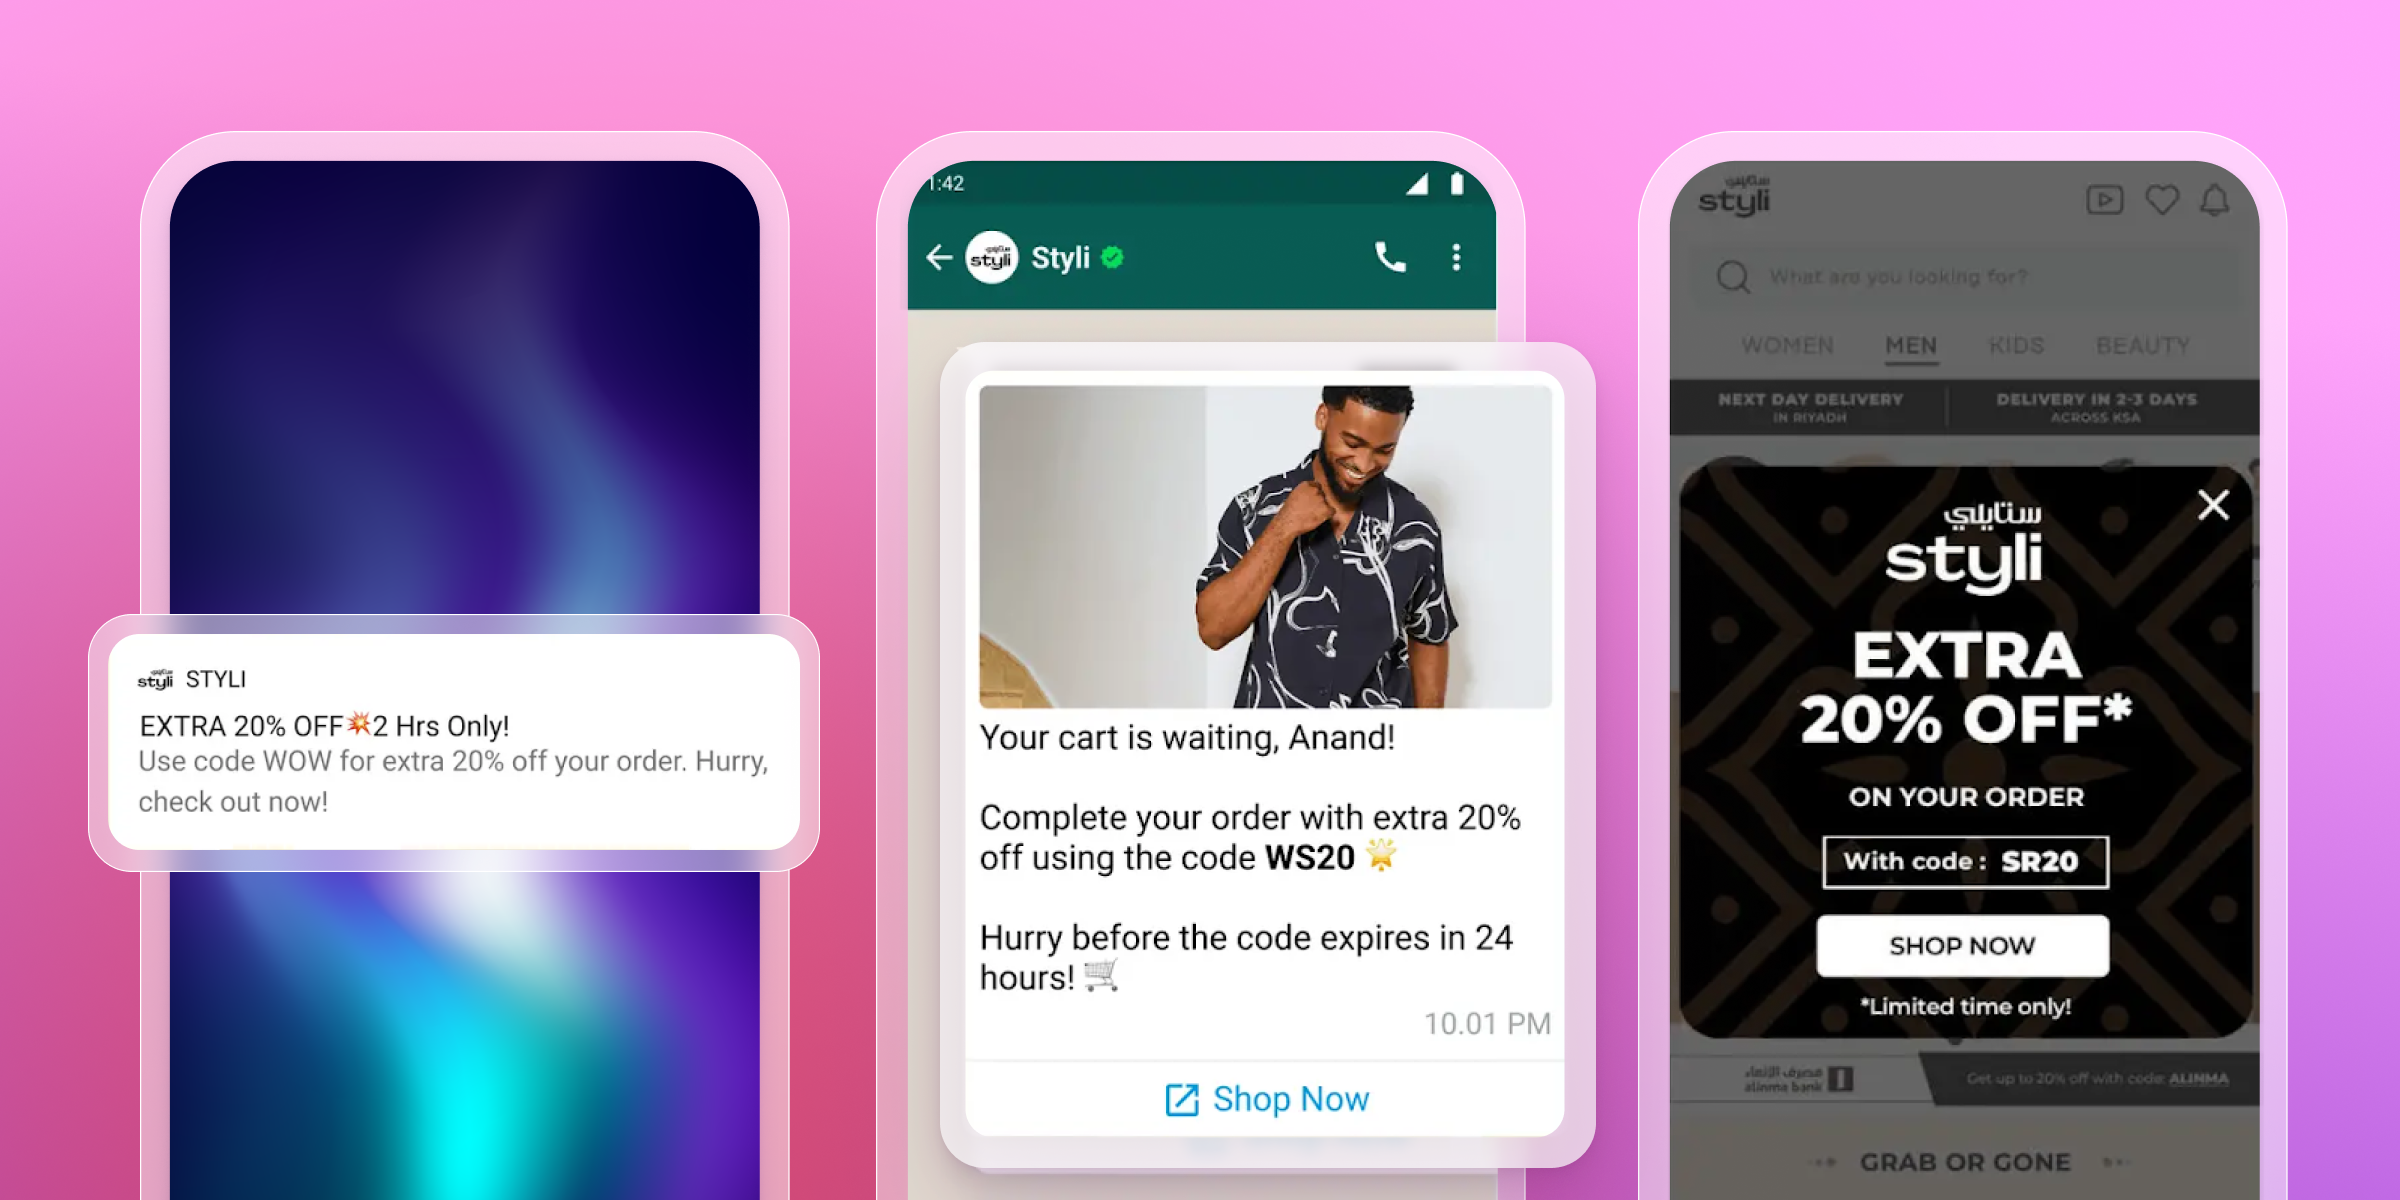
Styli, an eCommerce platform, aimed to enhance customer engagement through personalized messaging. By leveraging a cross-channel strategy including in-app messages, Content Cards, and push notifications, Styli delivered more relevant campaigns. This strategy led to a 15% rise in user activation and a 21% increase in sign-ups, indicating improved engagement metrics, including CTR.
See how Styli increased sign-ups and activation
7. In-app message conversion rate
In-app message conversion rate shows how often users take action after seeing a message inside the app. Whether it’s making a purchase, tapping a link, or completing a key flow, this metric ties content directly to outcomes.
- In-app conversion Rate = (Number of conversions / total number of in-app messages sent) x 100
Struggling to improve your conversion rate? Use behavioral triggers to display in-app messages when they’re most relevant, and optimize creative and copy placement through multivariate testing.
Max achieved 6X higher click rates with interactive in-app messages
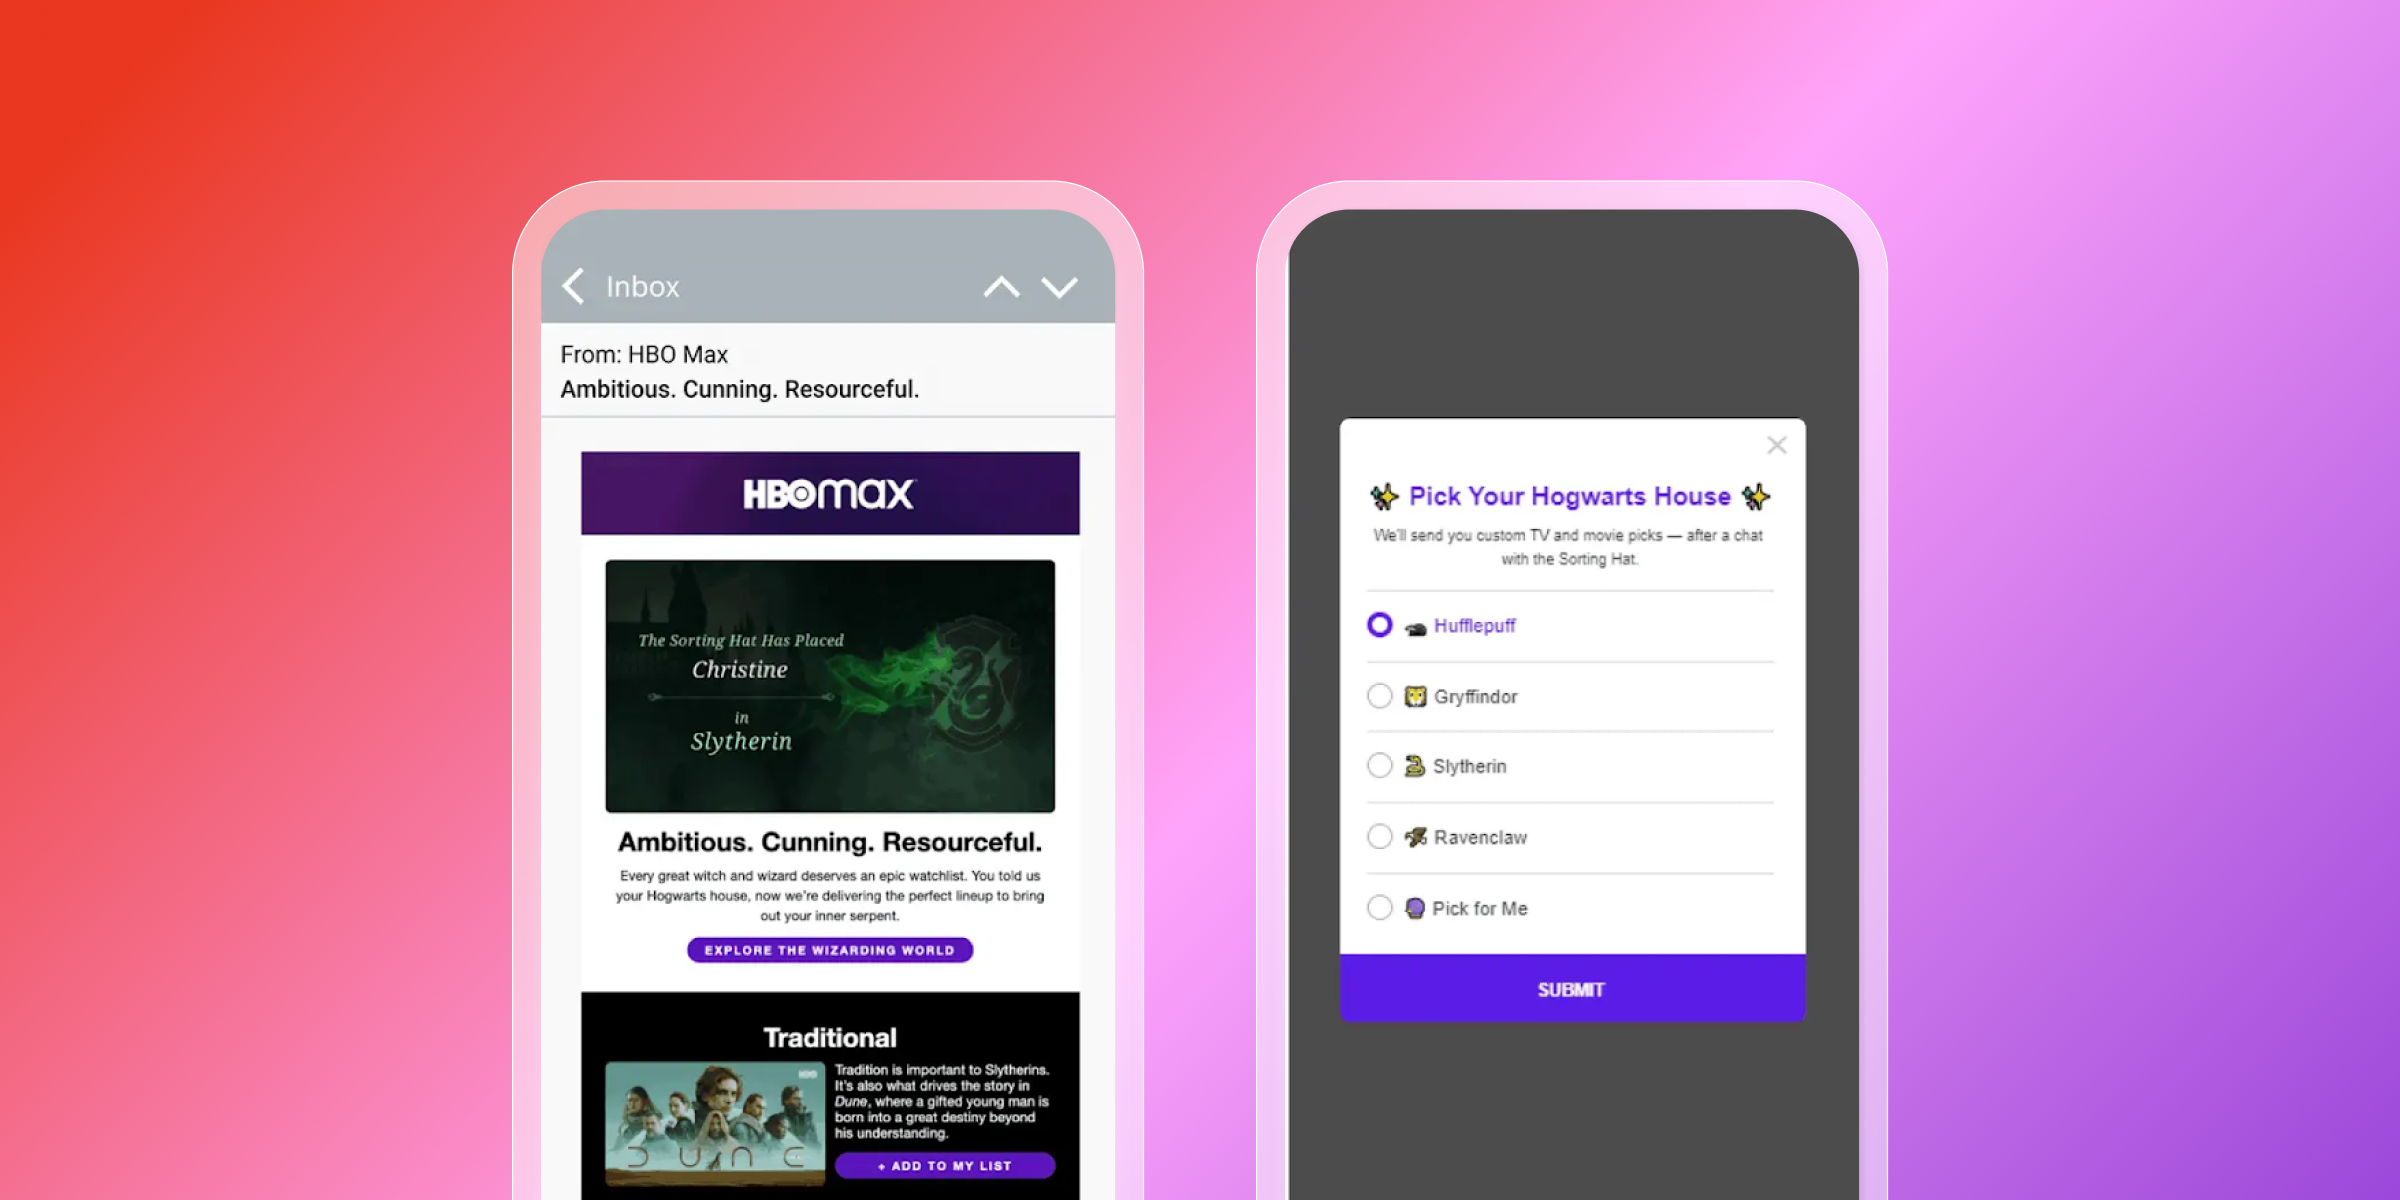
Max implemented a "What's Your Hogwarts House" survey using a Simple Survey in-app message to collect zero-party data. Based on users' selections, personalized emails or push notifications were sent, featuring curated content recommendations. This campaign led to a 6X increase in click rates on the in-app message compared to benchmarks.
Take a look at Max’s interactive messaging strategy
8. Feature adoption rate
Feature adoption measures how many users interact with a specific app feature after it’s launched. It’s essential for understanding which tools resonate and how to drive deeper engagement over time.
- Feature adoption = (Feature users / total users) × 100
To improve adoption, marketers can build feature discovery campaigns tied to user behavior and then track adoption through custom events and cohort analysis.
Real-life examples: Sephora SEA boosts AR feature adoption with targeted messaging

Sephora SEA introduced an augmented reality (AR) feature allowing users to virtually try on makeup. To increase awareness and usage, they implemented a step-by-step video delivered through push notifications, Content Cards and in-app messages. This targeted approach led to a 28% increase in user adoption and a 48% rise in overall traffic to the AR feature.
Discover how Sephora SEA drove AR feature adoption
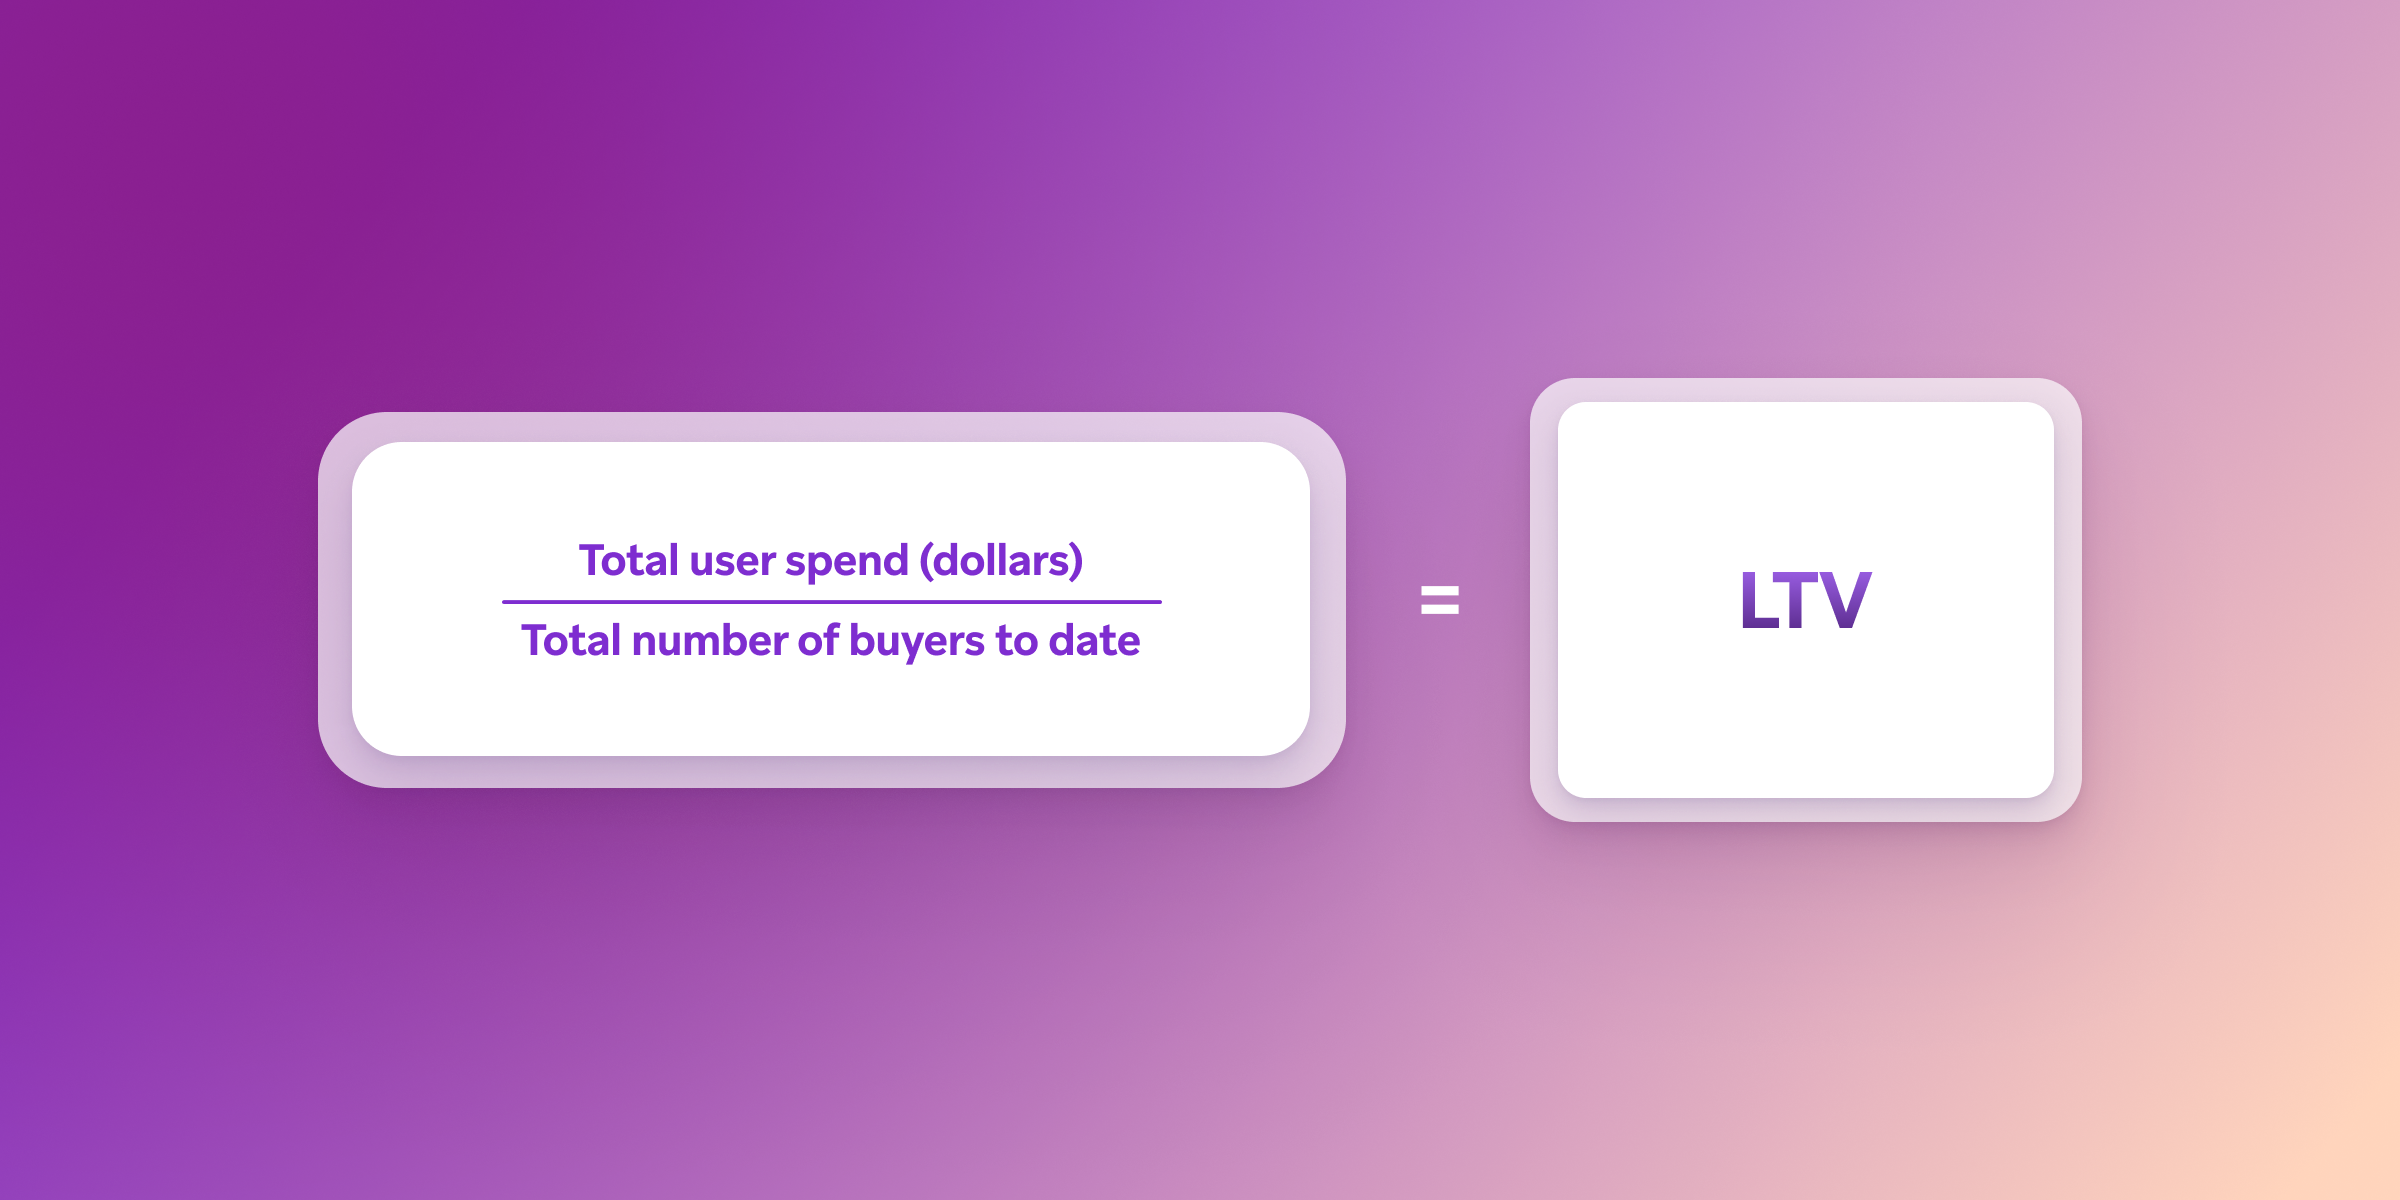
9. Lifetime value (LTV)
Lifetime value estimates how much revenue a user generates throughout their time with your app. While LTV models vary, the goal is to understand long-term ROI by user segment.
To improve lifetime value, focus on your retention efforts. For campaign ideas, check out the Braze Inspiration Guide.
Real-life example: Blacklane enhances LTV through personalized lifecycle campaigns
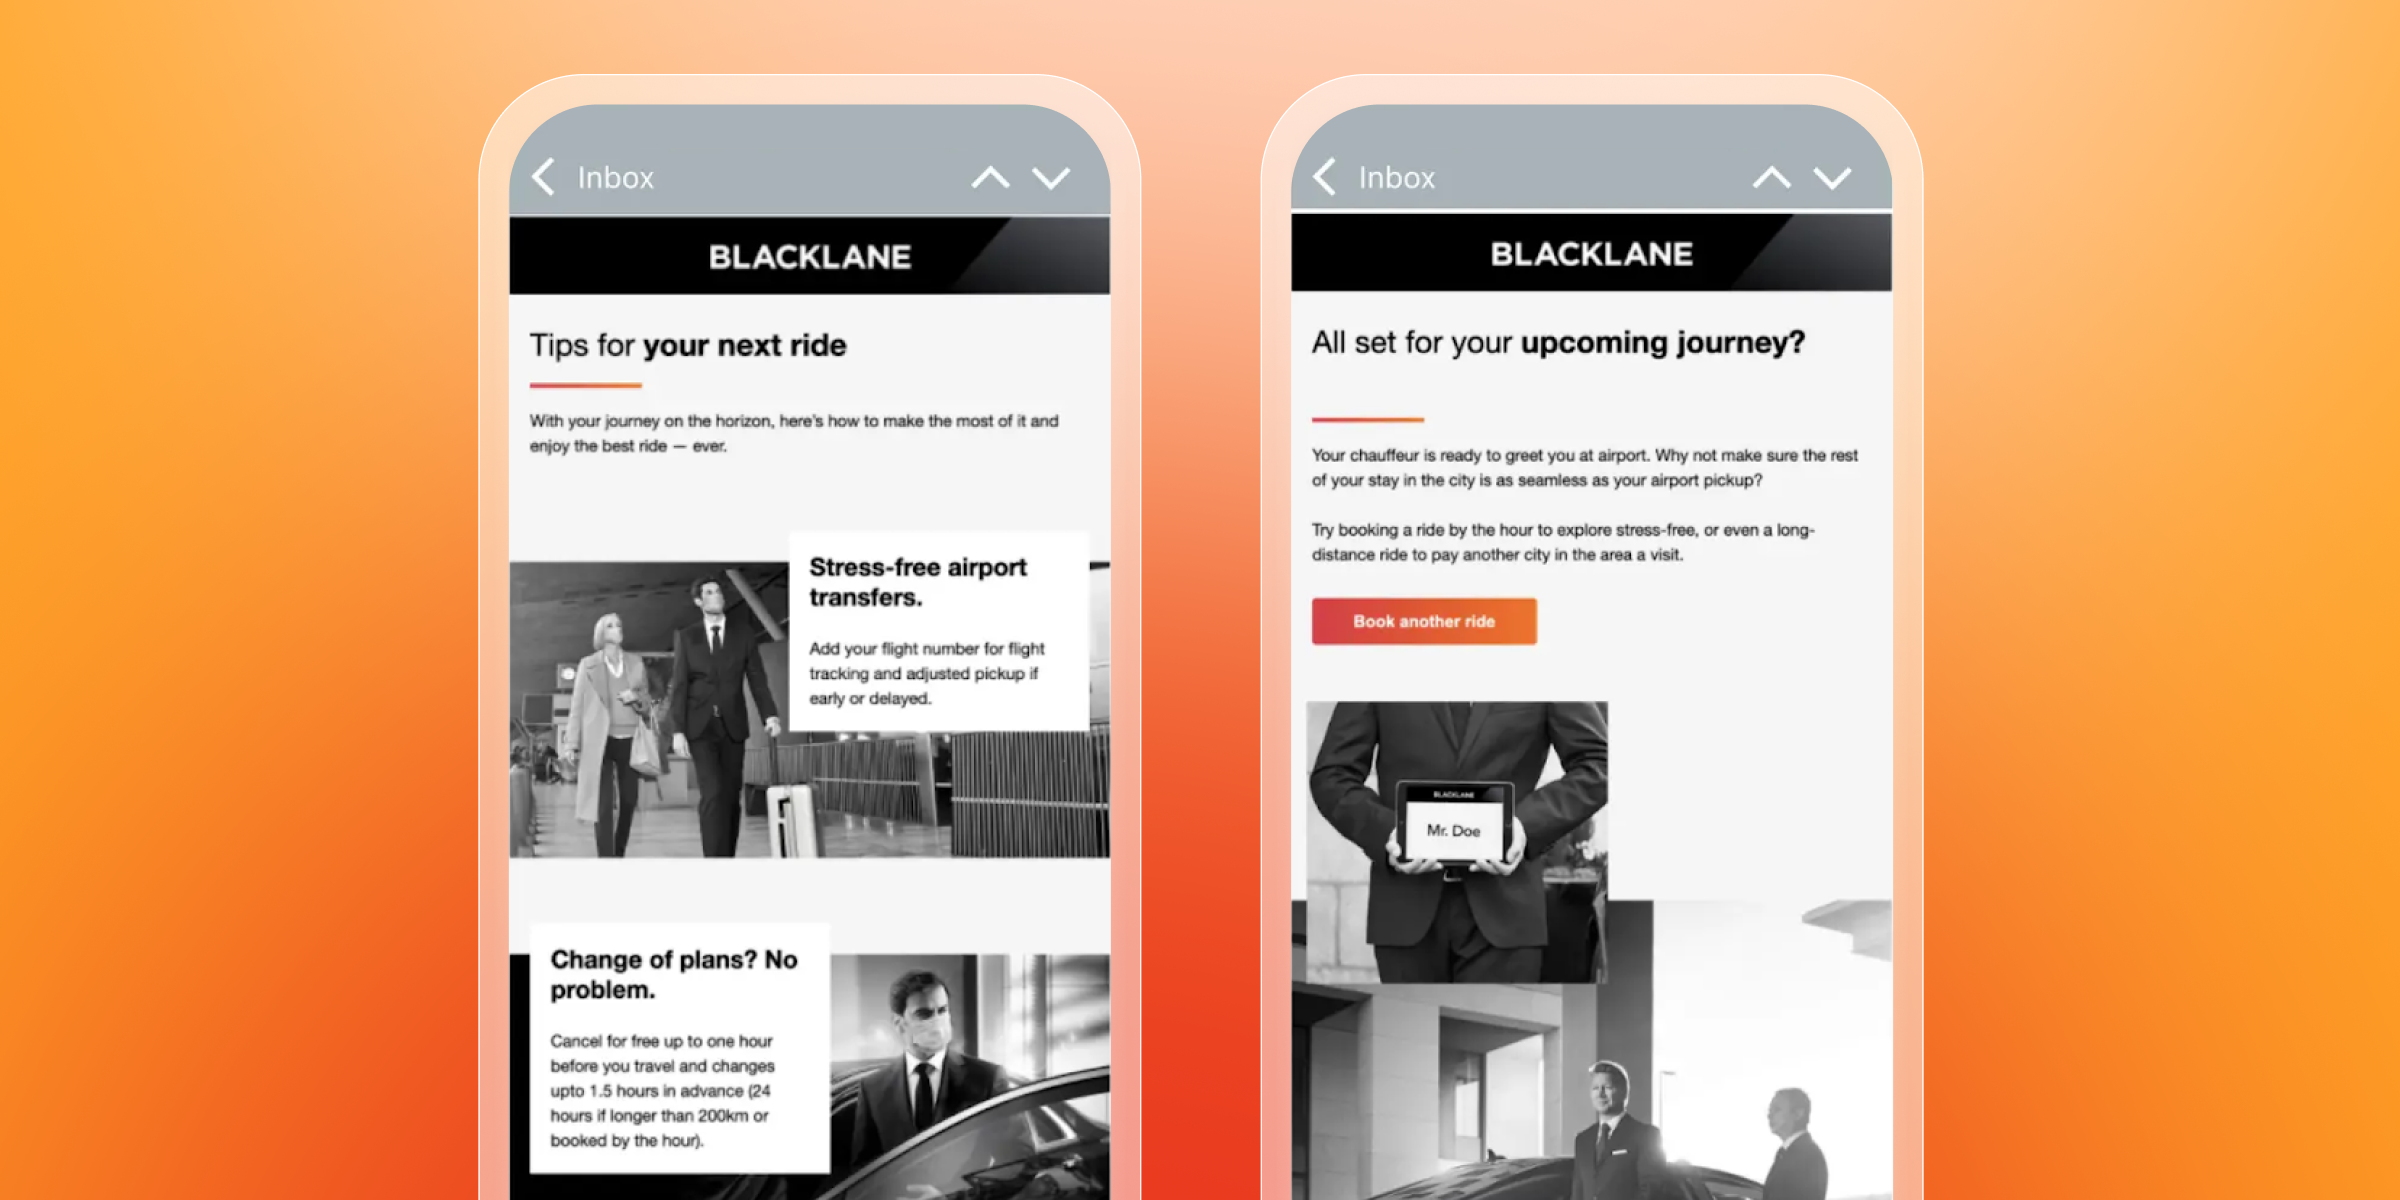
Blacklane aimed to maximize customer lifetime value by focusing on activating new users, retaining existing ones, and reactivating lapsed customers. Utilizing cross-channel messaging and real-time segmentation, they delivered personalized campaigns that led to a 194% improvement in lifecycle conversio,n and a 94% increase in CRM revenue.
Learn how Blacklane boosted lifecycle conversion and CRM revenue
10. Average revenue per user (ARPU)
ARPU looks at how much revenue each user generates on average. It’s especially useful when paired with LTV and churn retention metrics to understand monetization performance and guide strategy.
- ARPU = total revenue / total users
To better understand this metric, marketers can use custom events and revenue tracking to tie campaign engagement directly to outcomes. This helps link messaging performance with business impact and scale programs that move the needle.
Real-life example: American Dairy Queen boosted ARPU with targeted campaigns
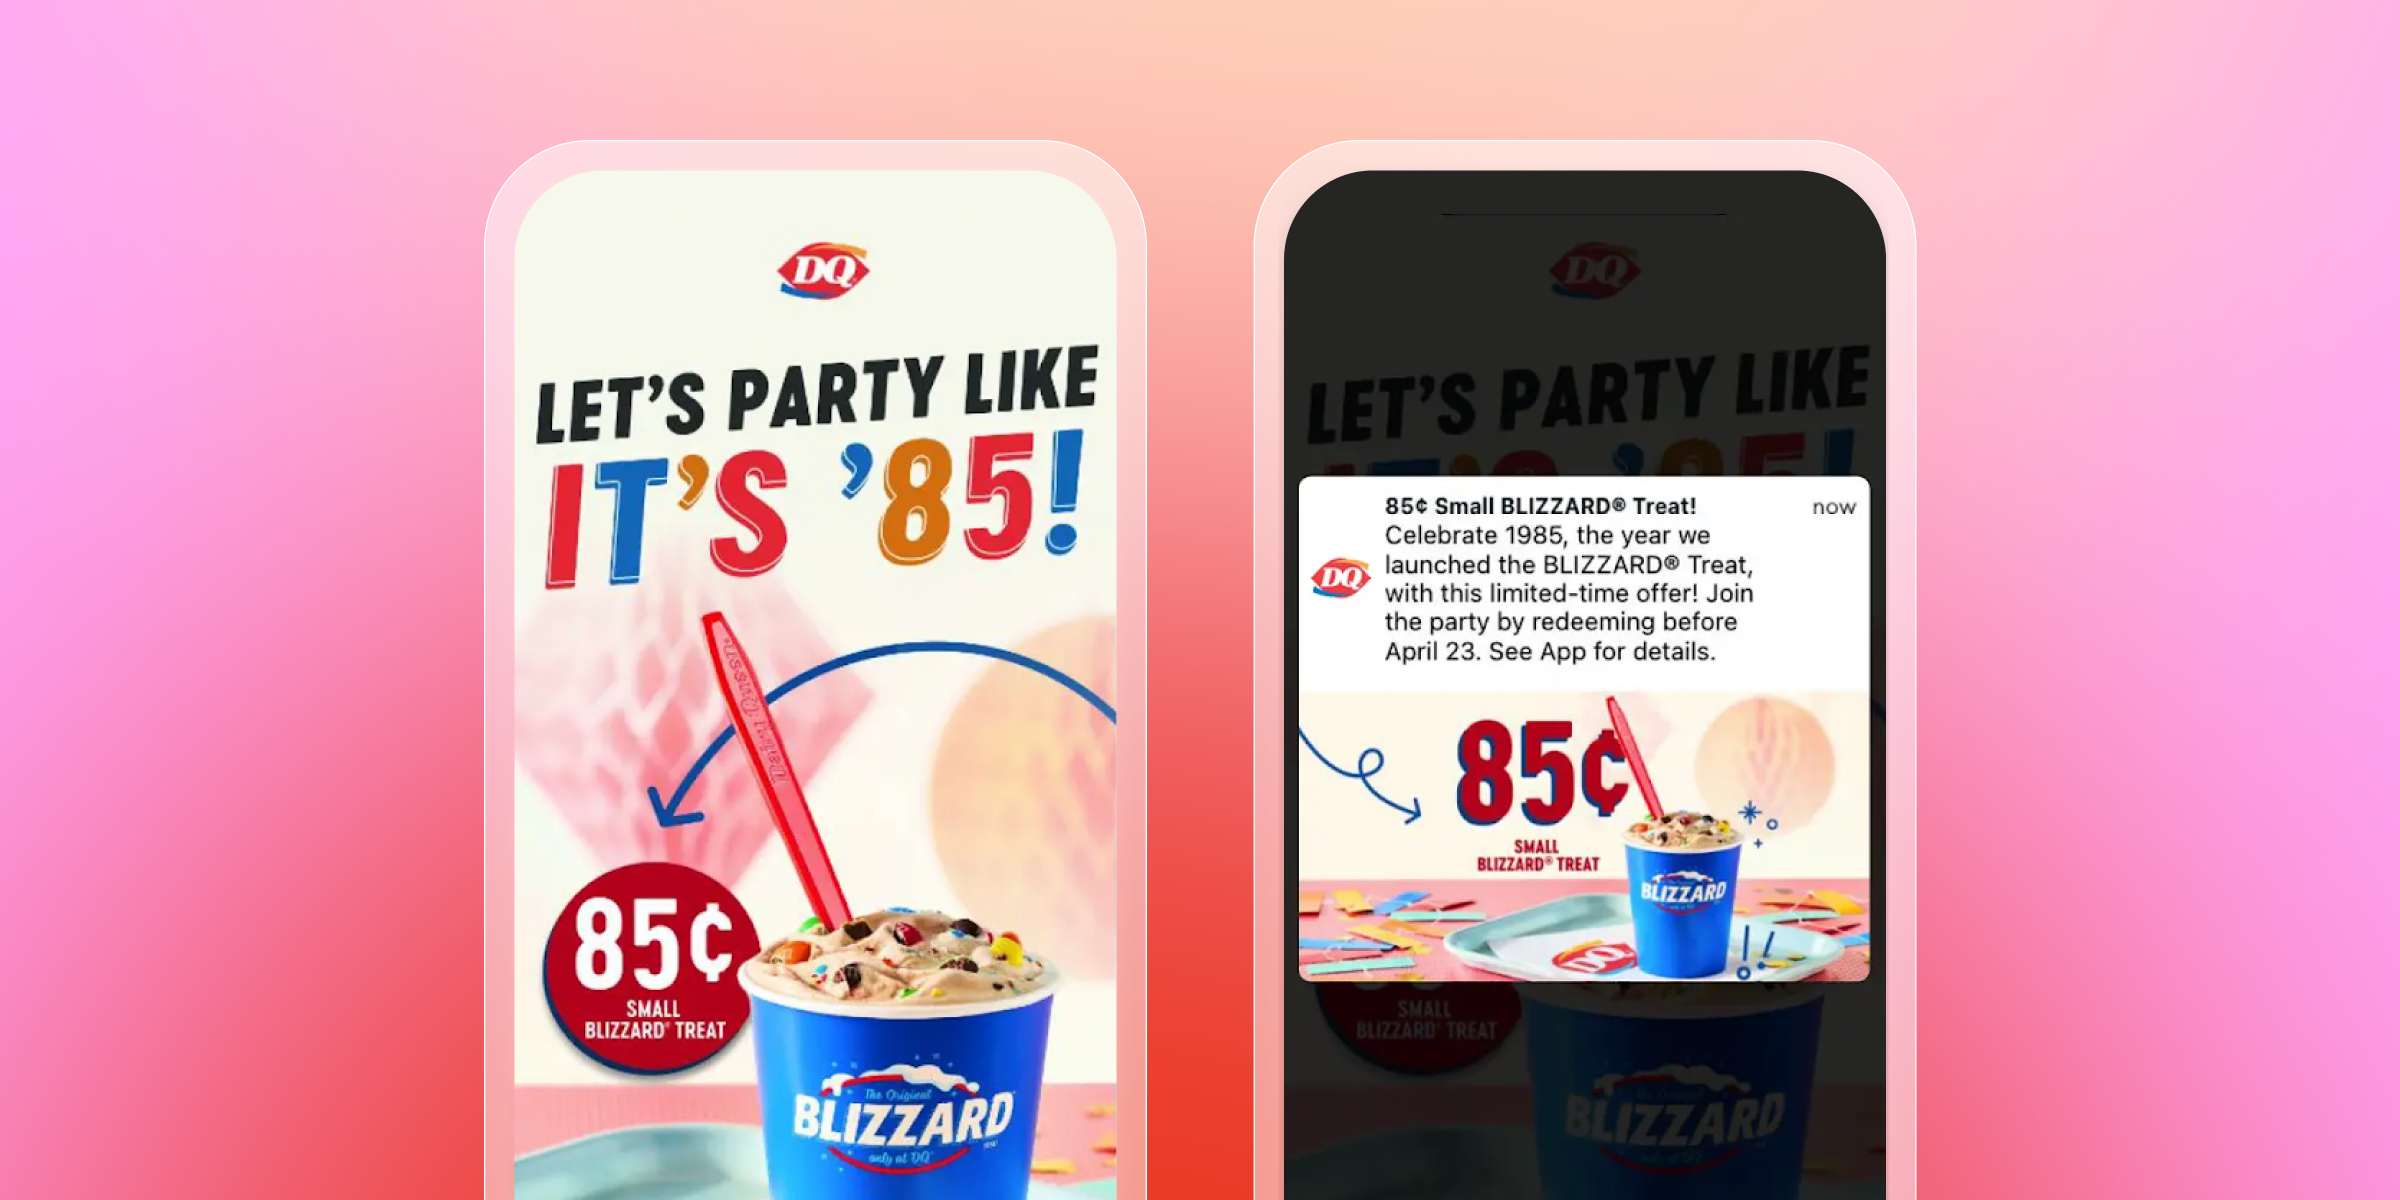
American Dairy Queen Corporation (ADQ) sought to increase fan engagement and loyalty sign-ups. By testing various welcome offers and implementing the most successful one nationally through Braze, ADQ achieved a 138% increase in revenue compared to its average monthly CRM revenue, reflecting a significant boost in ARPU.
Find out how ADQ increased monthly CRM revenue
Watch this webinar to explore the tools and tactics leading brands are using to make it easier for them to self-serve, improve their outcomes, and own engagement from the first email to the final report.
How to act on mobile metrics and engagement KPIs using Braze
Tracking mobile app metrics is only the first step. Data alone doesn’t improve engagement. You need the ability to interpret it, apply it, and adapt in real time. Braze is built to help marketers move from insight to execution—without waiting on analysts, engineering, or external tools.
Here’s how to use Braze to turn mobile metrics into action:
1. Track the metrics that matter with Report Builder
Start by creating reports that track core KPIs like daily active users (DAU), retention rates, push opt-in, or conversion performance. With Report Builder, you can slice performance by campaign, segment, or timeframe—without relying on SQL or external analytics tools.
2. Visualize performance with Dashboard Builder
Use Dashboard Builder to monitor top-line metrics in real time. Whether you’re watching for churn signals or measuring the impact of a new feature launch, dashboards help you track trends across your full engagement program.
3. Understand user behavior with Funnel Reports and Query BuilderFor deeper insight into the customer journey, tools like Funnel Reports and Query Builder let you explore session patterns, drop-off points and goal completion rates. Use these to pinpoint where users are engaging–or where they’re dropping off.
4. Build segments that adapt in real time based on mobile behaviorYou can group users by behavior, attributes, or events. Want to message users who installed in the last seven days but haven’t completed onboarding? You can build that audience and create a flow to engage them.
By combining insight and execution in one platform, Braze helps you close the loop between what users do and how you respond. No delays, no handoffs—just smarter engagement, powered by real-time data and the mobile app metrics that matter most.
FAQs for mobile application KPIs
What are mobile app metrics?
Mobile app metrics and mobile application KPIs are performance and engagement KPIs that show how users interact with your app. These are some of the most important app metrics to track if you want to understand user behavior and improve retention.
How do you grow users with mobile app metrics?
By tracking metrics like DAU and opt-in rate retention, marketers can identify what works and use tools like Braze to deliver timely, personalized messages that drive growth.
How do you measure the success of a mobile app?
App success is measured through KPIs like retention rate, LTV, churn, and engagement. Combining these metrics with Braze’s reporting tools helps brands track impact and optimize over time.
Related Tags
Be Absolutely Engaging.™
Sign up for regular updates from Braze.
Related Content
 Article7 min read
Email deliverability across APAC: Navigating a diverse digital landscape
July 31, 2026 Article4 min read
The new CNIL recommendations: Email tracking pixels in France
July 30, 2026 Article6 min read
Built to Scale: Announcing the 10 Startups Joining Cohort 6 of Braze Product Grant Program
July 30, 2026