Data-driven decisions: How startups can use reporting and analytics to enhance customer engagement
Published on December 08, 2025/Last edited on January 12, 2026/6 min read
Team Braze
Running marketing at a startup business means making every decision count. Budgets are tighter, teams are smaller, and time is always in short supply. This means you can’t afford to guess which campaigns are working or where customers are dropping off.
That’s where reporting and analytics make the difference. The right data doesn’t just show what happened last week—it helps you decide what to do next. By connecting insights across email, mobile, and web, startups can see what drives engagement in real time and adjust campaigns before opportunities are lost.
Put simply, when data is clear, your team moves faster. You understand your customers better. And you can focus your effort where it matters most: creating experiences that build loyalty and long-term growth. Let’s dive into how that’s achieved!
Why data-driven decision-making matters
For growing businesses, data is one of the few tools that can close the gap with larger competitors. It brings structure to what can often feel like trial and error.
When you can see how customers interact across touchpoints—how they browse, click, or convert—you gain a clearer view of what’s working and what isn’t. That visibility turns small insights into strategic decisions such as which audiences to invest in, which messages to refine, and which channels to scale.
The real opportunity lies in connecting the dots between all those signals. Instead of tracking metrics in isolation, startups can use analytics to uncover the full story behind customer behavior—what motivates engagement, when interest starts to fade, and how to intervene in time to make a difference.
Deriving valuable insights from your data
Many startups already collect a steady stream of data like purchase history, website traffic, app activity, email engagement, and social interactions. The real challenge is knowing how to turn that information into a clear direction.
Here are three simple steps to do exactly that:
- Start with what you already knowLook for patterns in your best-performing moments such as the campaigns that drove repeat purchases, or the content that consistently earns clicks. These are signals about what your customers value and where your messaging resonates.
- Connect signals across channelsA website visit tells one part of the story. An abandoned cart, an email open, or an in-app click adds more context. When those data points come together, you begin to see how different touchpoints influence each other and where customers might be falling off.
- Use insight to drive actionAnalytics are most powerful when they inform quick, focused changes. If engagement drops after onboarding, that may indicate a need for stronger follow-up. If customers consistently respond to educational content, double down on that strategy to build loyalty.
Over time, this approach shifts your marketing from reactive to intentional. Instead of wondering why a campaign underperformed, you’ll know where to look to gauge program health and how to respond.
Tools to turn data into direction
It’s important for growing businesses to understand what’s driving engagement and where to adjust. Clear analytics make that possible by showing which messages, channels, and moments create real impact.
Braze reporting and analytics capabilities give teams a complete view of customer behavior across channels in one place. You can track performance, compare results, and identify opportunities to optimize—all without extra tools or complex setup.
- Visual dashboards show engagement across email, mobile, web, and in-app campaigns in real time.
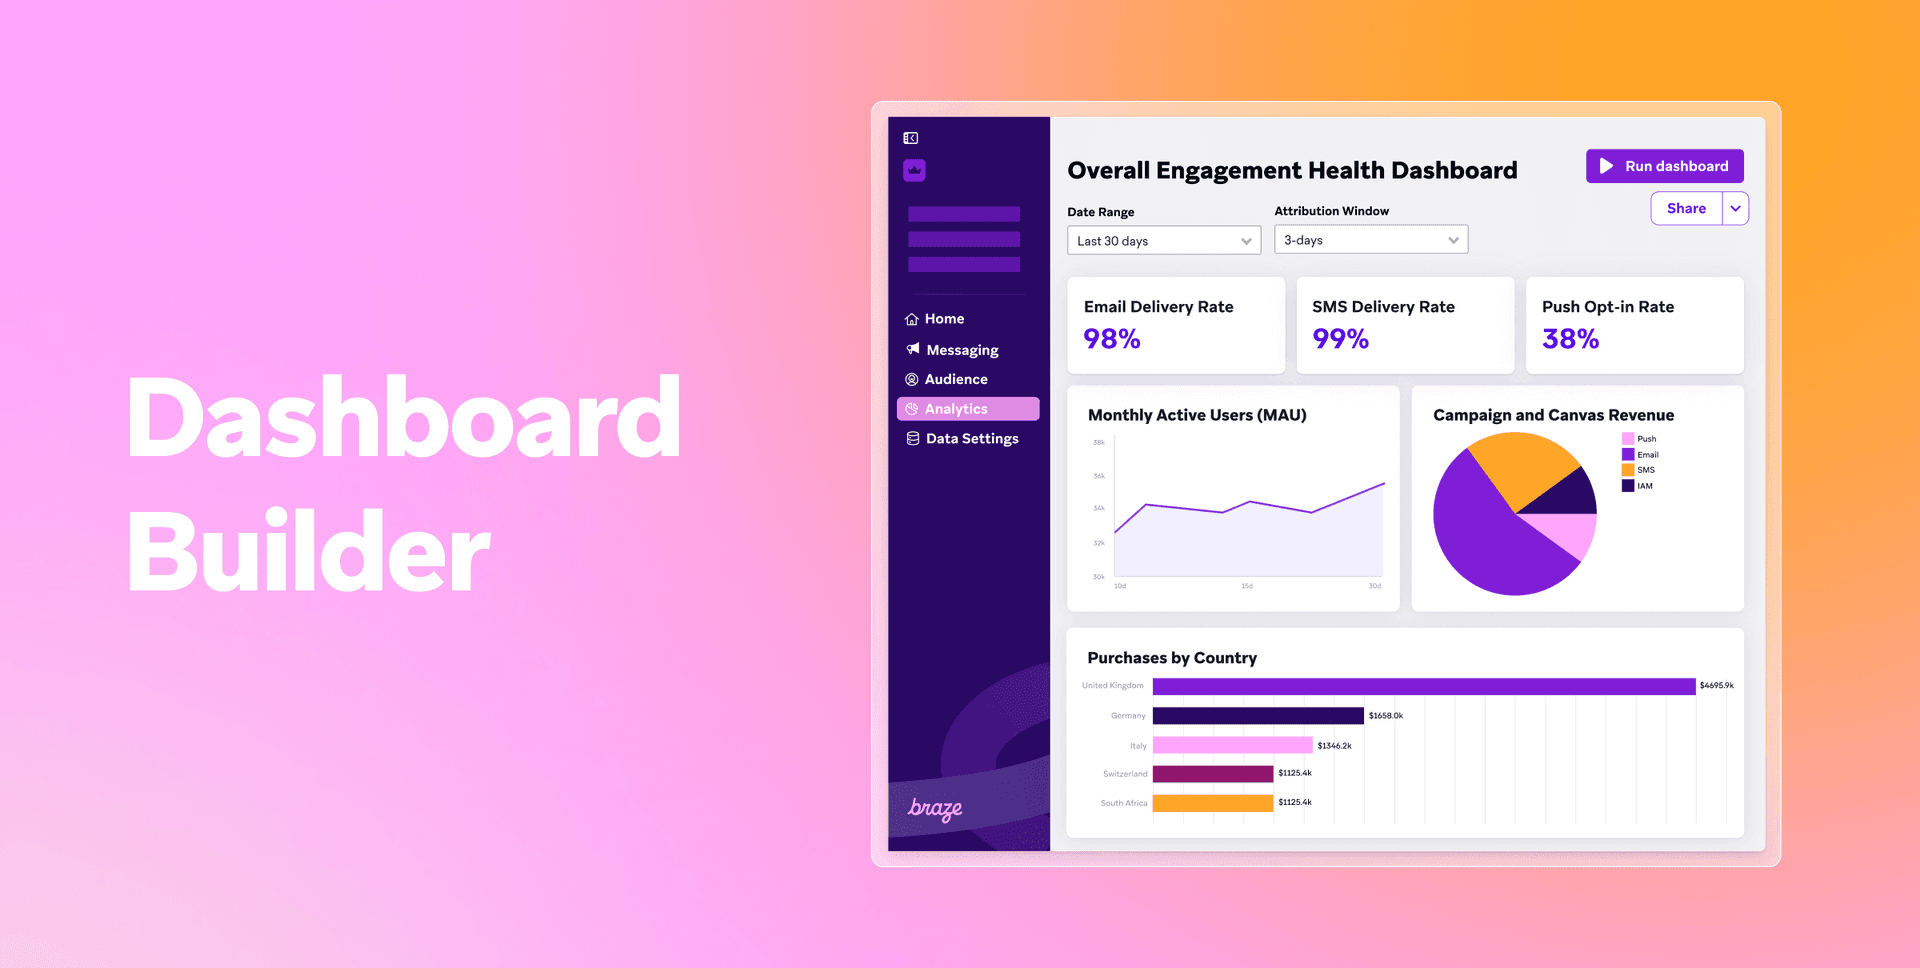
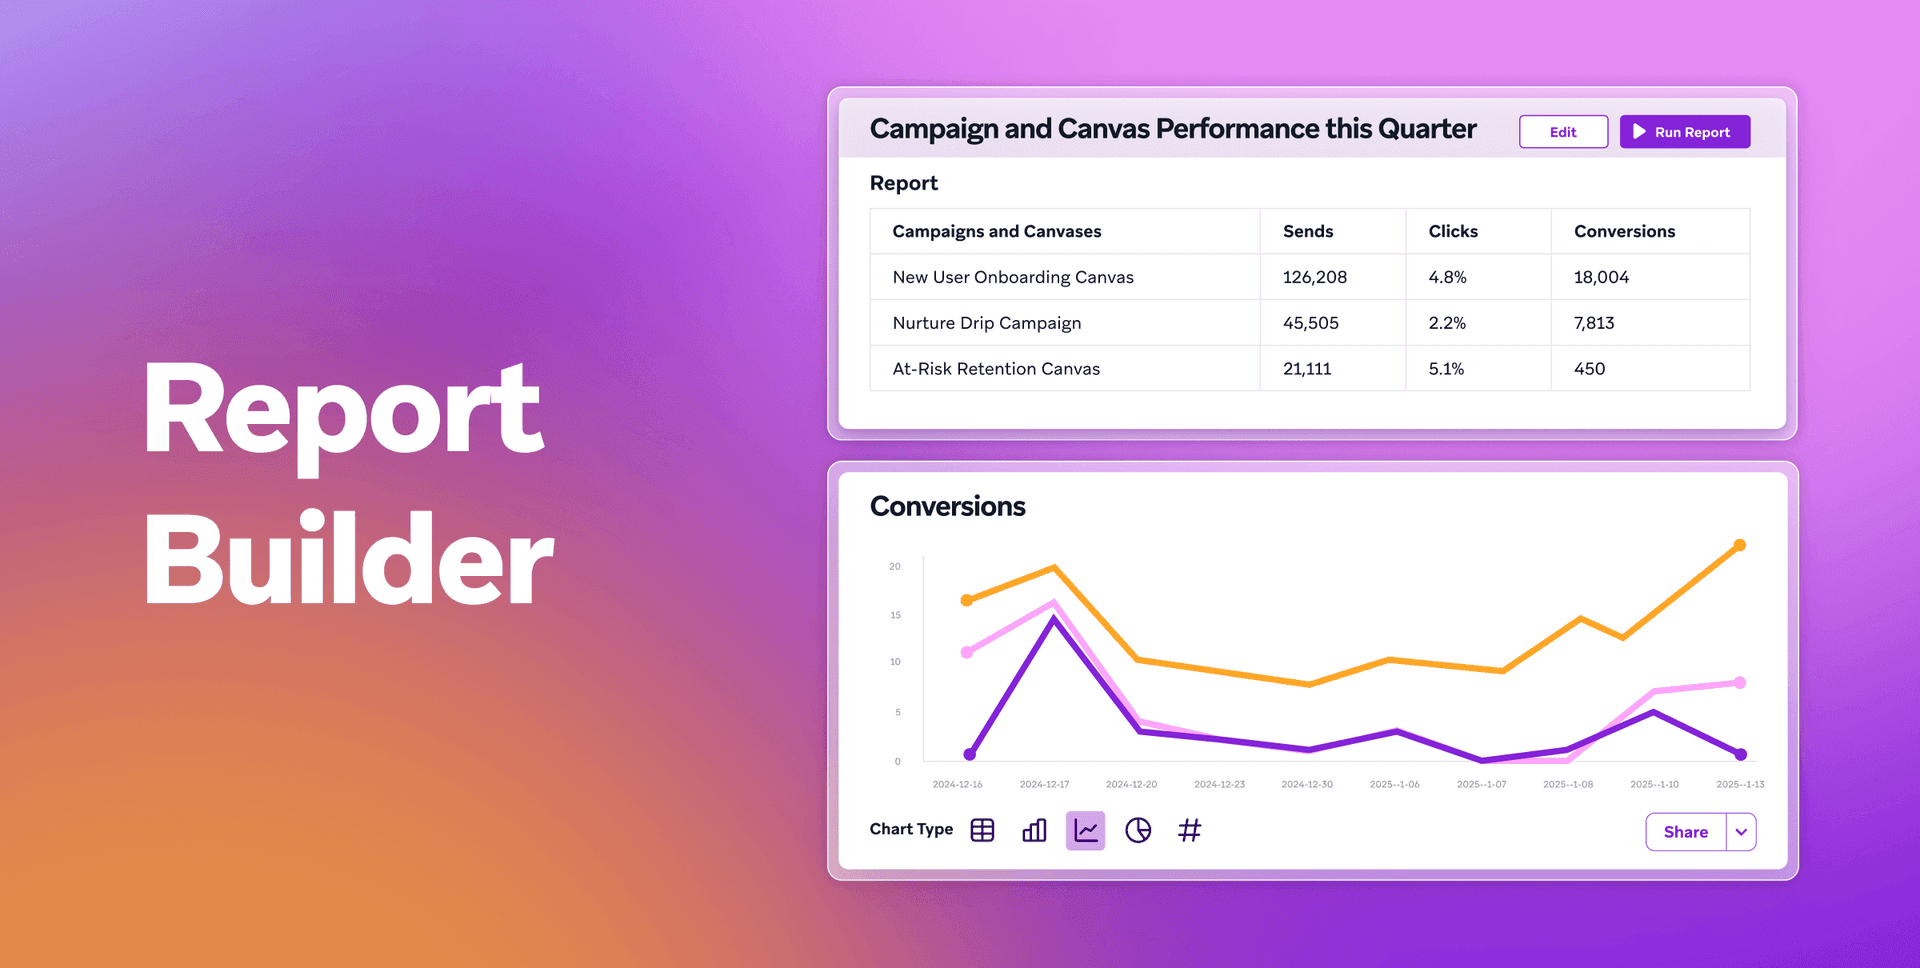
- Campaign comparisons highlight top-performing messages and journeys so you can refine content with confidence.
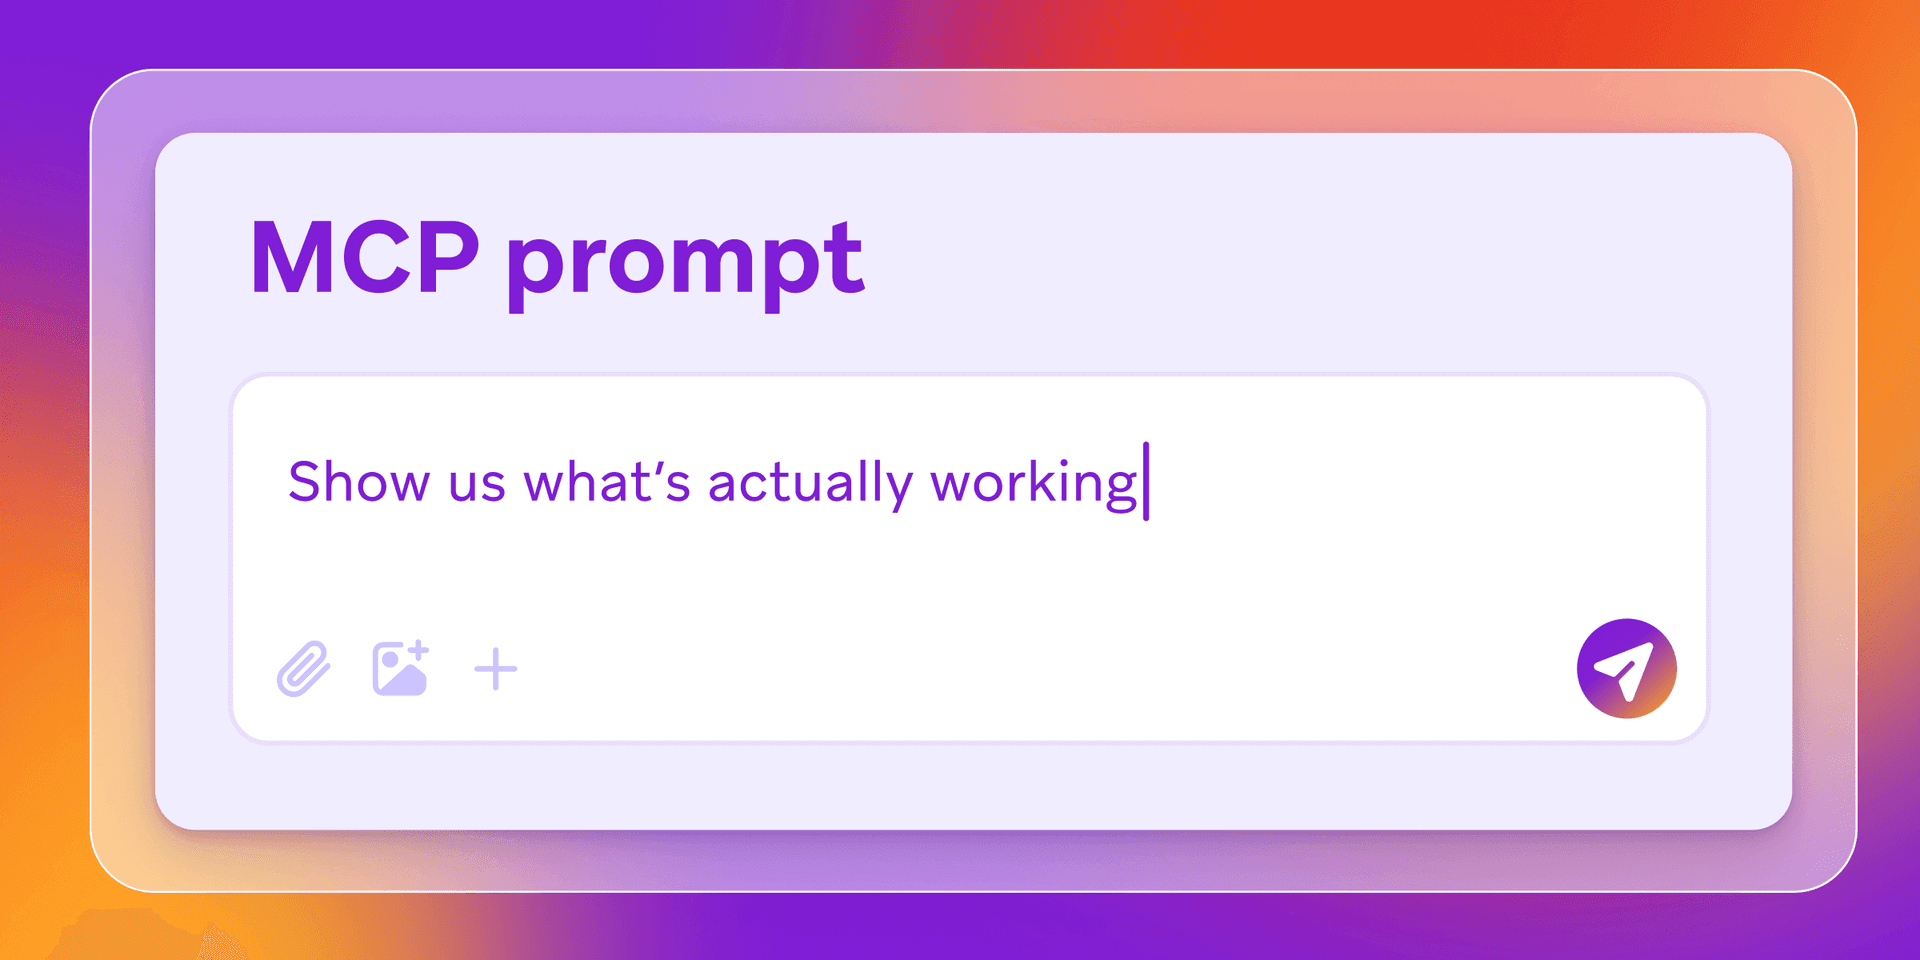
- Conversational insights let you ask questions in natural language through the Braze MCP Server and get instant answers.
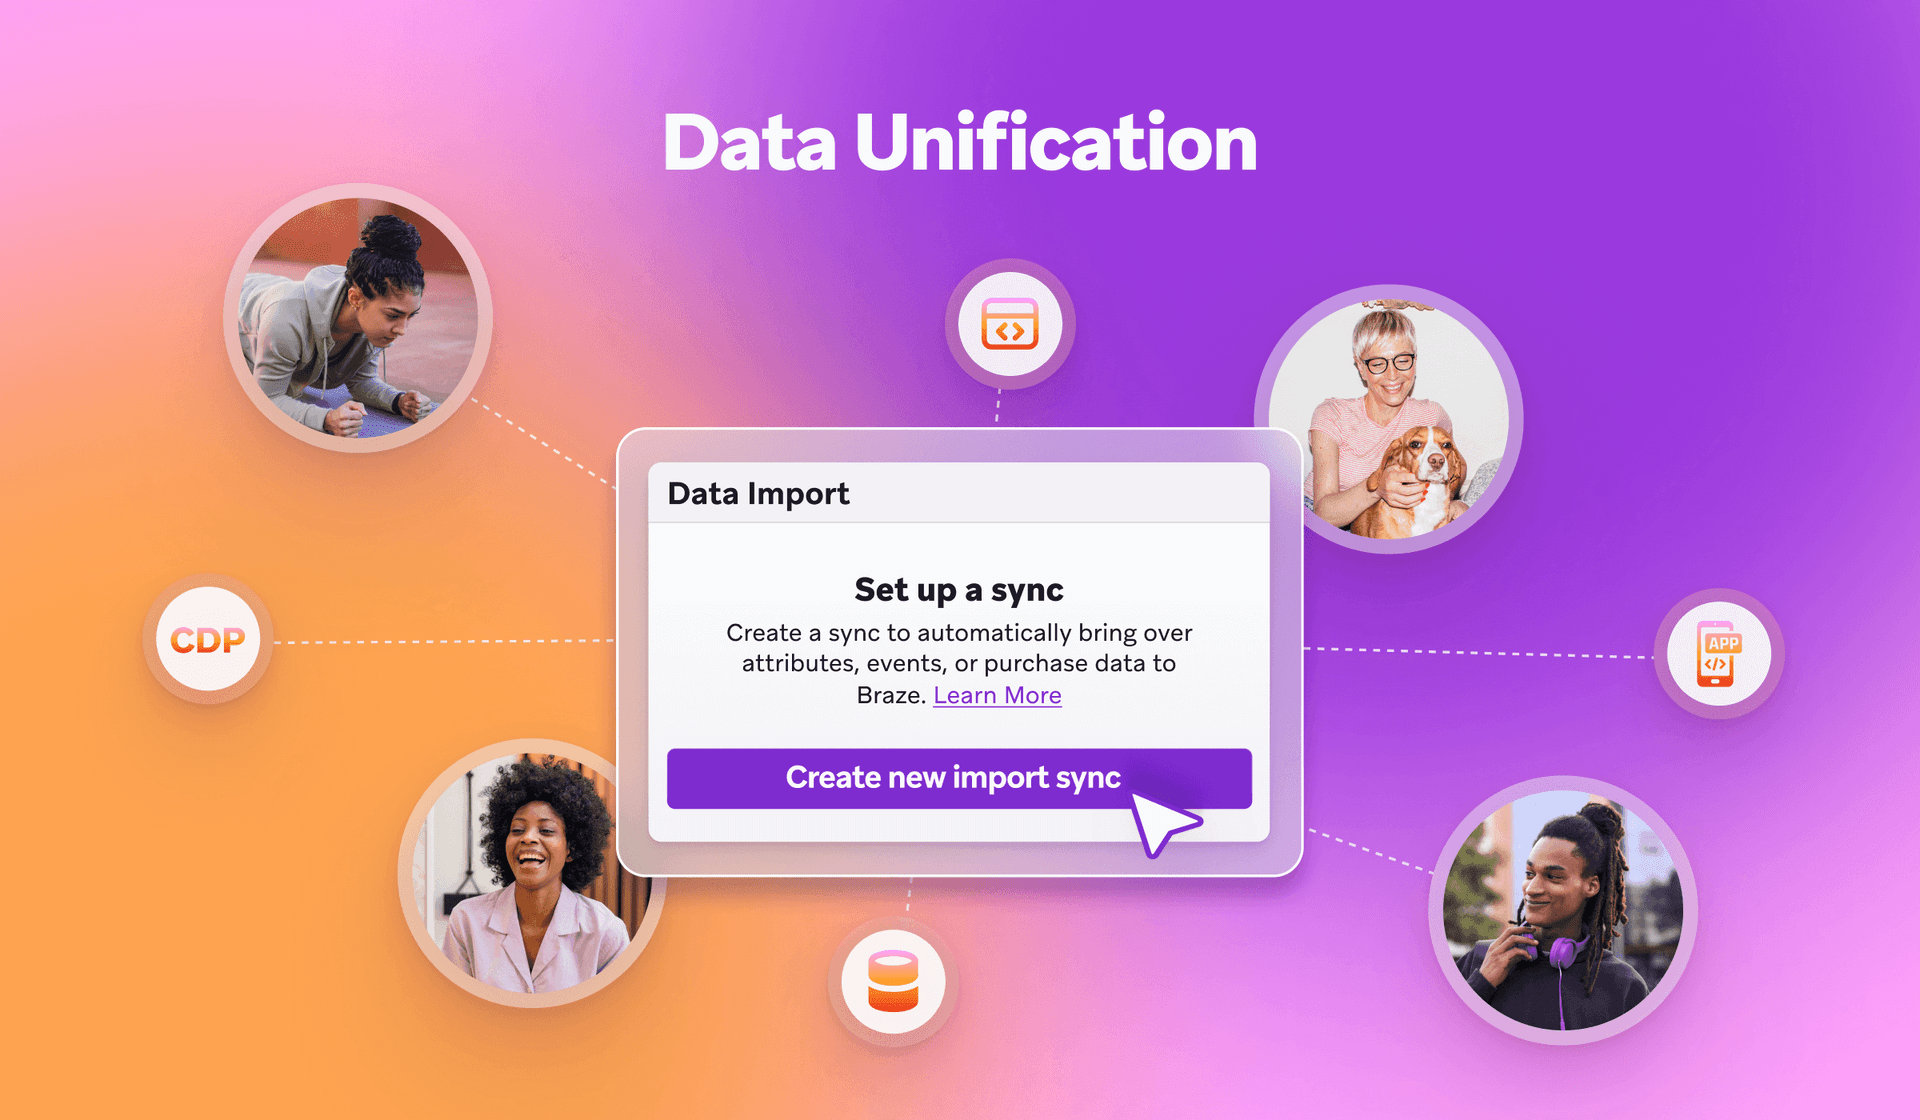
- Unified customer data connects activity across systems via the Braze Data Platform, giving you a single, accurate picture of your audience.
These features help startups act faster and smarter, turning everyday data into direction for stronger, more consistent customer engagement.
Real results, powered by Braze
Across industries, growing teams use Braze capabilities such as those just covered to make smarter decisions with the data they already have. Our reporting and analytics tools help them see what’s working, where to improve, and how to keep customers engaged.
- Viber used Braze analytics to identify the performance drivers behind its campaigns, leading to a 50% increase in conversions.
- Showmax applied reporting insights to tailor engagement by region and strengthen retention through localized recommendations.
- Taxfix simplified analysis and improved deliverability with Braze, saving time on data management while gaining scale.
Each of these companies began with the same goal: to understand their customers and act with confidence. The clarity they gained helped them test ideas faster and focus on what mattered most: building stronger, more connected relationships with their customers.
Measuring success and driving continuous improvement
Now that we've covered the importance of taking an interest in reporting and analytics, and how to use Braze to support program success, we must point out that strong analytics are about more than just measuring results. For best-in-class results, marketers should create a feedback loop that helps teams learn, adapt, and improve over time. For startups, the goal is to track both engagement and long-term business health. That means watching the numbers that reflect how customers connect with your brand and how those interactions translate into revenue.
Key metrics to track include:
- Engagement rates: Opens, clicks, and in-app actions that reflect how interested your audience is in what you’re sharing.
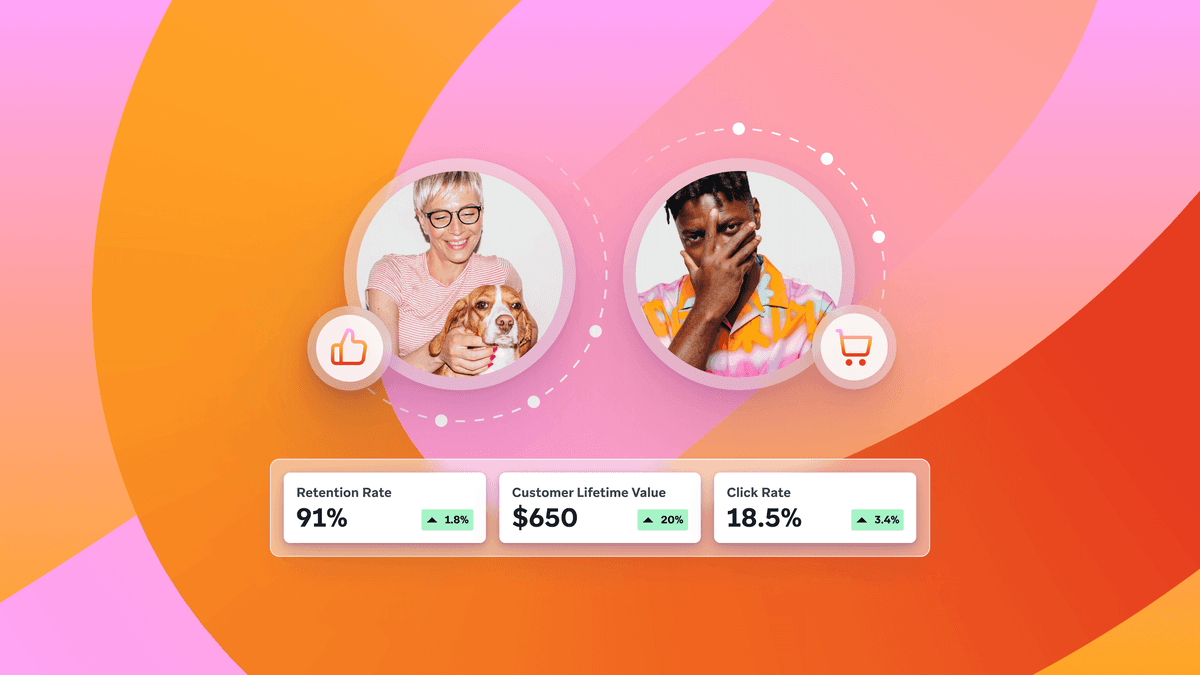
- Retention rates: The percentage of customers who remain active over time and return for repeat experiences.
- Customer lifetime value (CLV): The total contribution of a customer from first purchase through long-term loyalty.
- Conversion and revenue trends: How engagement efforts lead to measurable growth.
With Braze, these metrics live in one place. Teams can see how campaigns perform in context, share insights easily, and identify what to adjust next. Each cycle of testing and iteration makes your marketing smarter and more efficient, building stronger results with every campaign.
Final thoughts: Start making data work for you
For startup businesses, data can turn everyday marketing into lasting connections. When teams understand what’s driving engagement, they can act with clarity, refine their approach, and grow customer relationships that last.
Braze reporting and analytics capabilities make it easier to see those patterns and use them with purpose. Clear insights, connected data, and real-time feedback help teams make smarter decisions and create more meaningful customer experiences.
When marketing is guided by insight, every campaign becomes an opportunity to strengthen engagement and build momentum for growth.
Be Absolutely Engaging.™
Sign up for regular updates from Braze.
Related Content
 Article3 min read
From "sent" to "seen": Introducing Email Deliverability Essentials
April 14, 2026 Article3 min read
Why VPPA forces media brands to choose between compliance and relevance, and how to avoid that tradeoff
April 13, 2026 Article11 min read
Customer engagement in financial services: real-world examples that work
April 09, 2026